Back to BIGWIG Finance

Ethereum Shows Signs of Bottoming Out After 17% Correction

ETHEREUM CRYPTOCURRENCY

February 24, 2025 at 08:44 AM

BREAKING NEWS
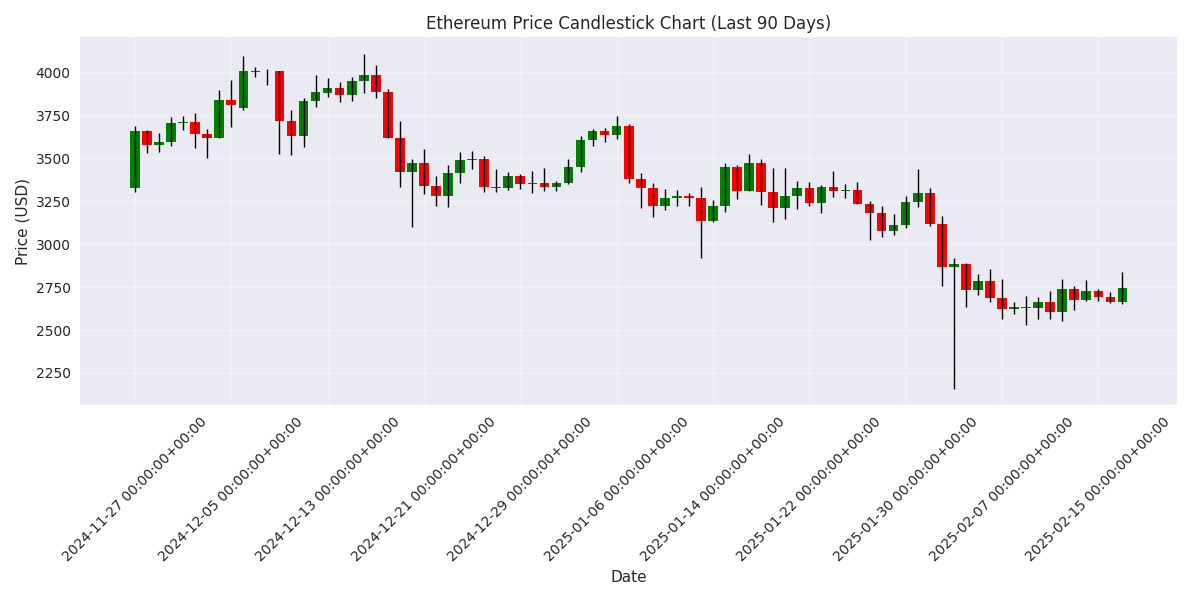
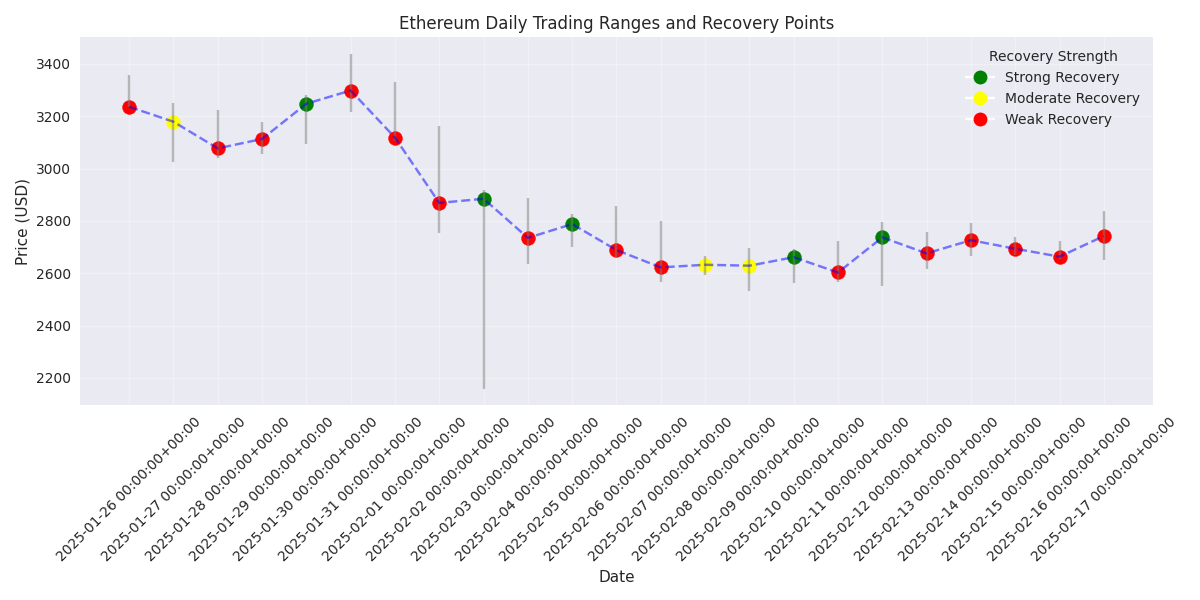
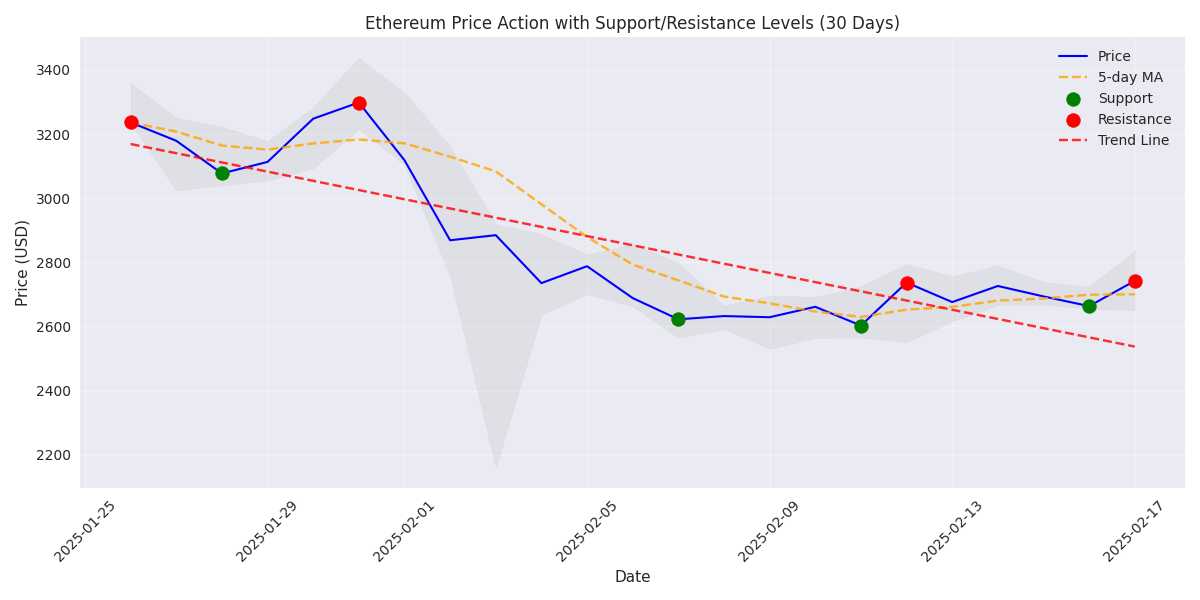
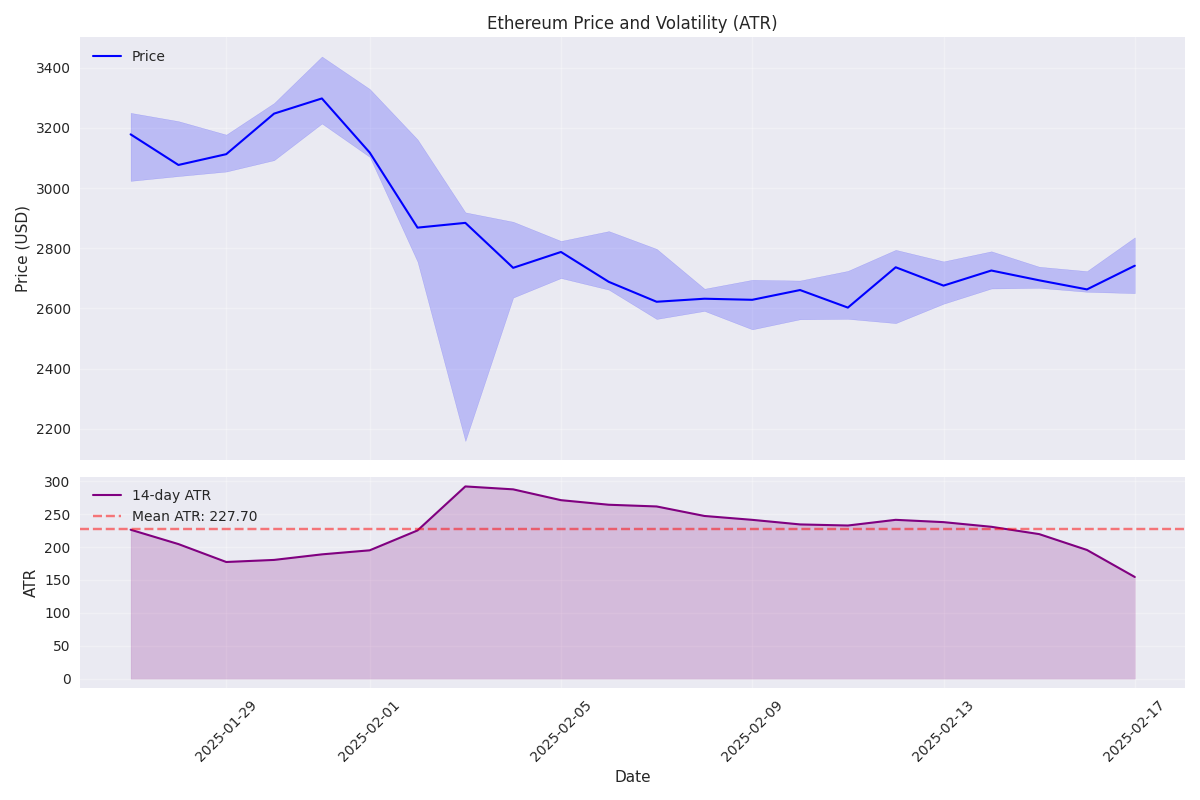
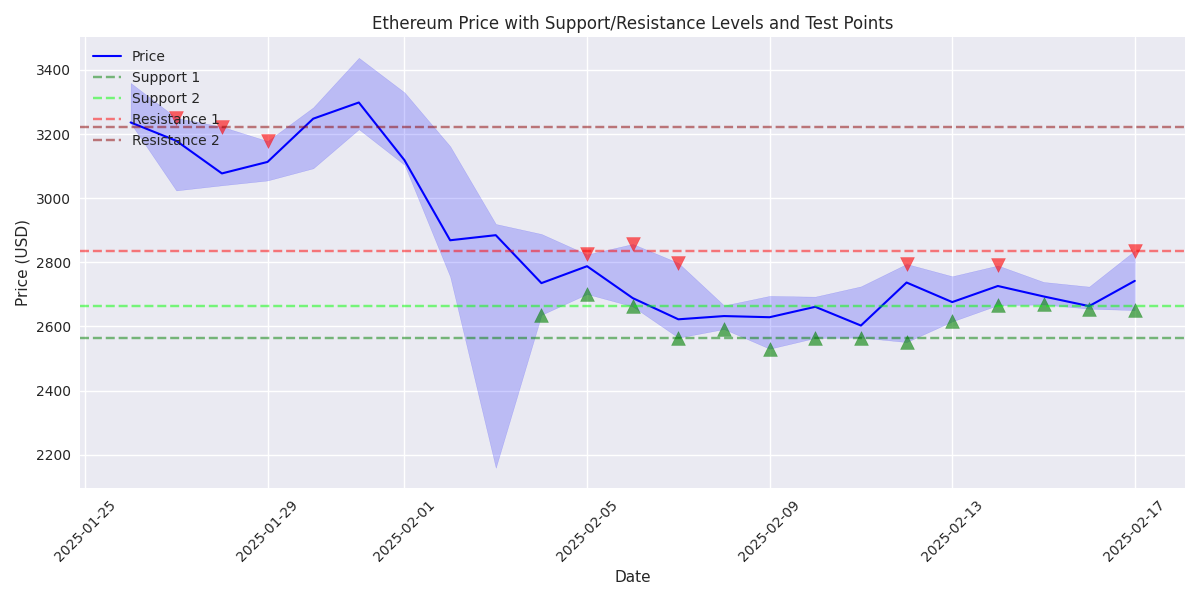
ETH has found strong buying support at $2,600 after a sharp 17% correction from $3,298. Recent 5.15% gain suggests potential trend reversal. Technical traders note formation of double bottom pattern at $2,600 level, with decreased volatility signaling potential trend change. Key resistance levels to watch at $2,740 and $2,900.
Ethereum Shows Signs of Bottoming Out After 17% Correction
•••

Ethereum's Market Pulse: Traders' Quick Guide to Price Movements and Hidden Opportunities

Ethereum Forms Double Bottom at $2,600 After 17% Drop

ETH shows strong signs of bottoming after falling from $3,298 to $2,600. Recent price action forms double bottom pattern with decreased volatility and 5.15% gain. Key resistance levels at $2,740 and $2,900 need to be cleared for confirmation.

Volume Analysis Suggests Active Accumulation Phase

Heavy buying volume of 50 billion during recent dips indicates strong market conviction. Current volume decline to 48 billion with price consolidation suggests accumulation phase before potential upward move.

Trading Models Favor Short-Term Positions

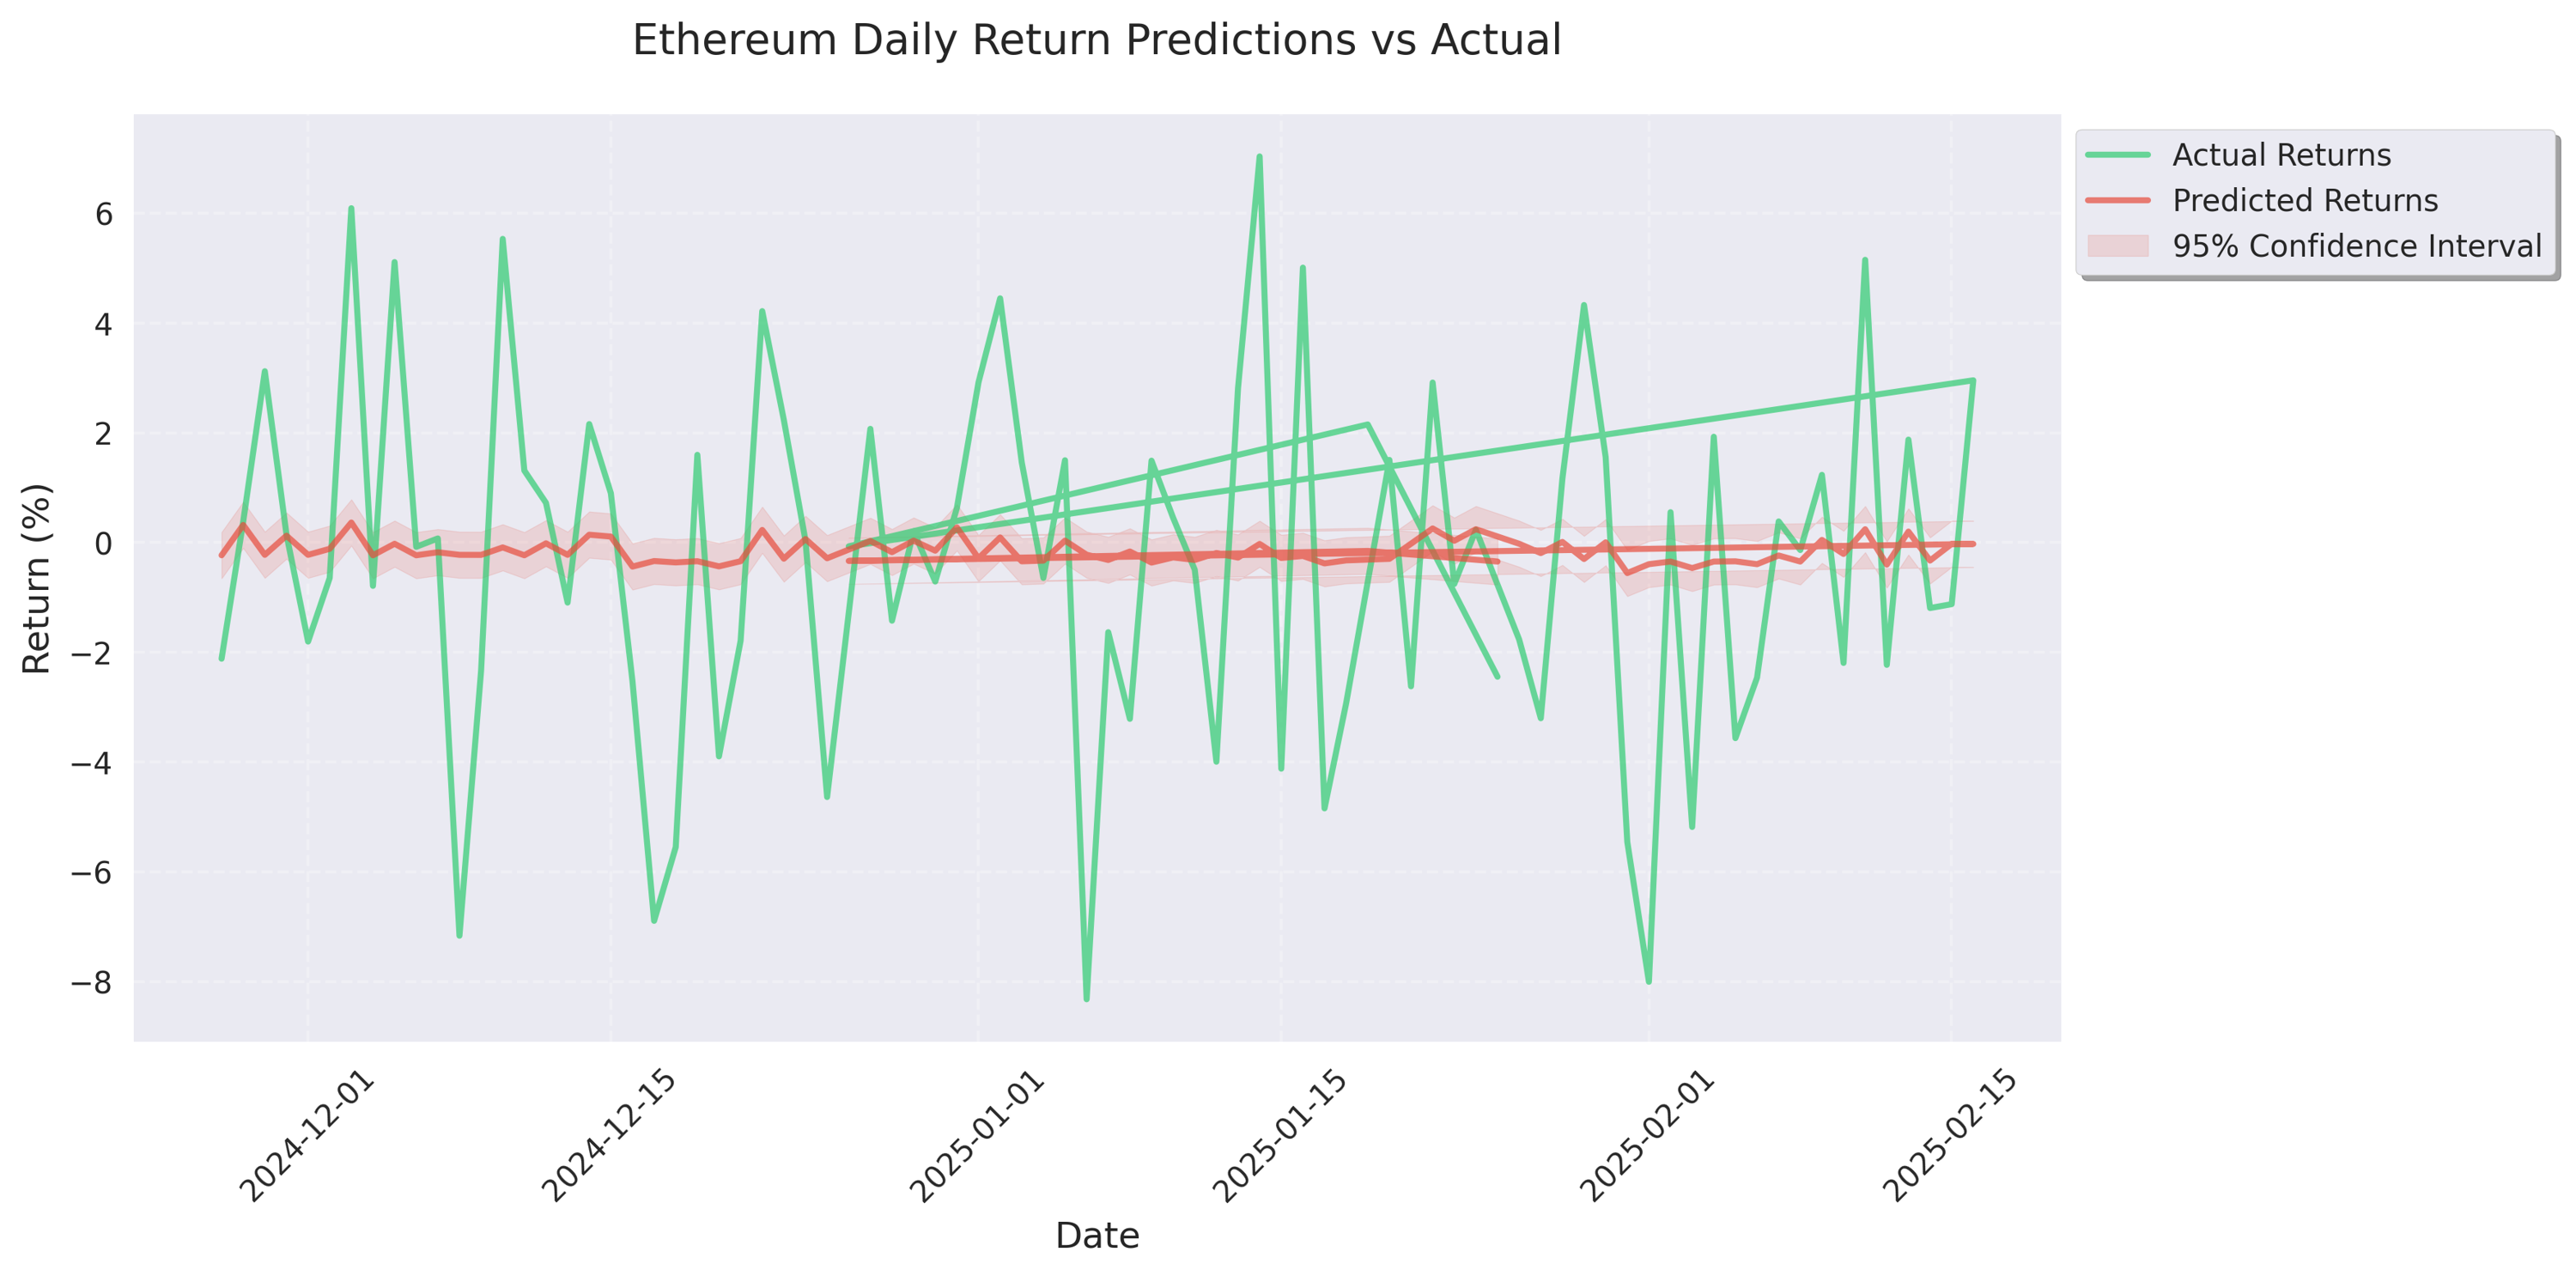
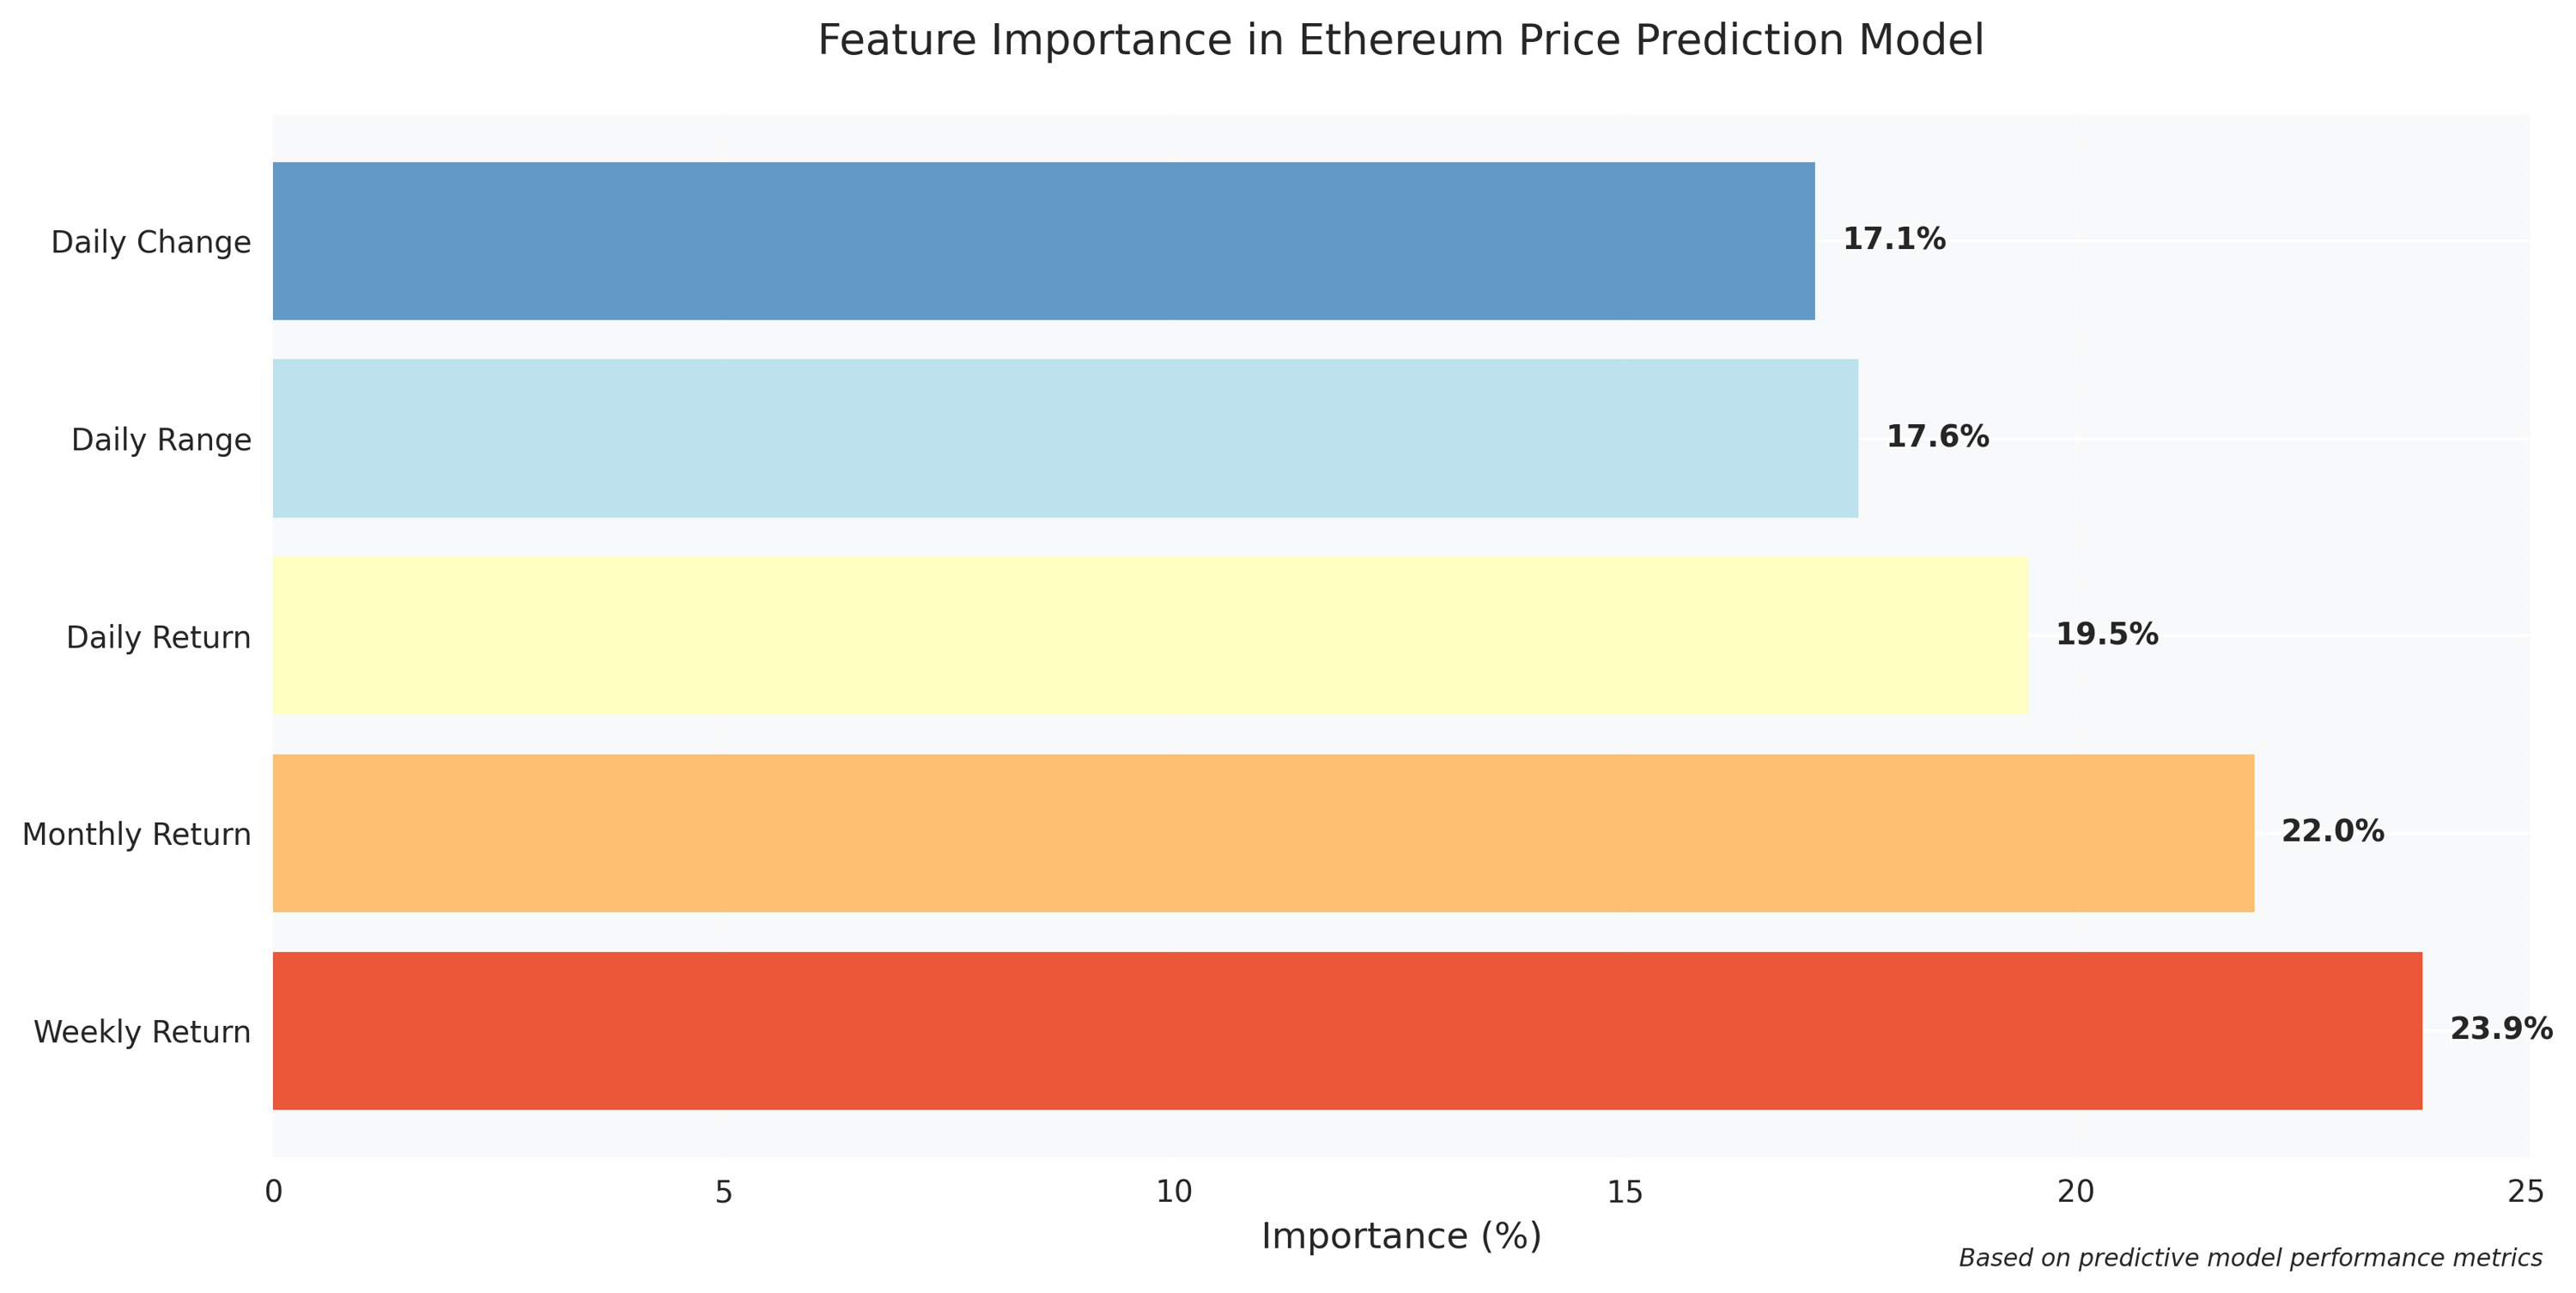
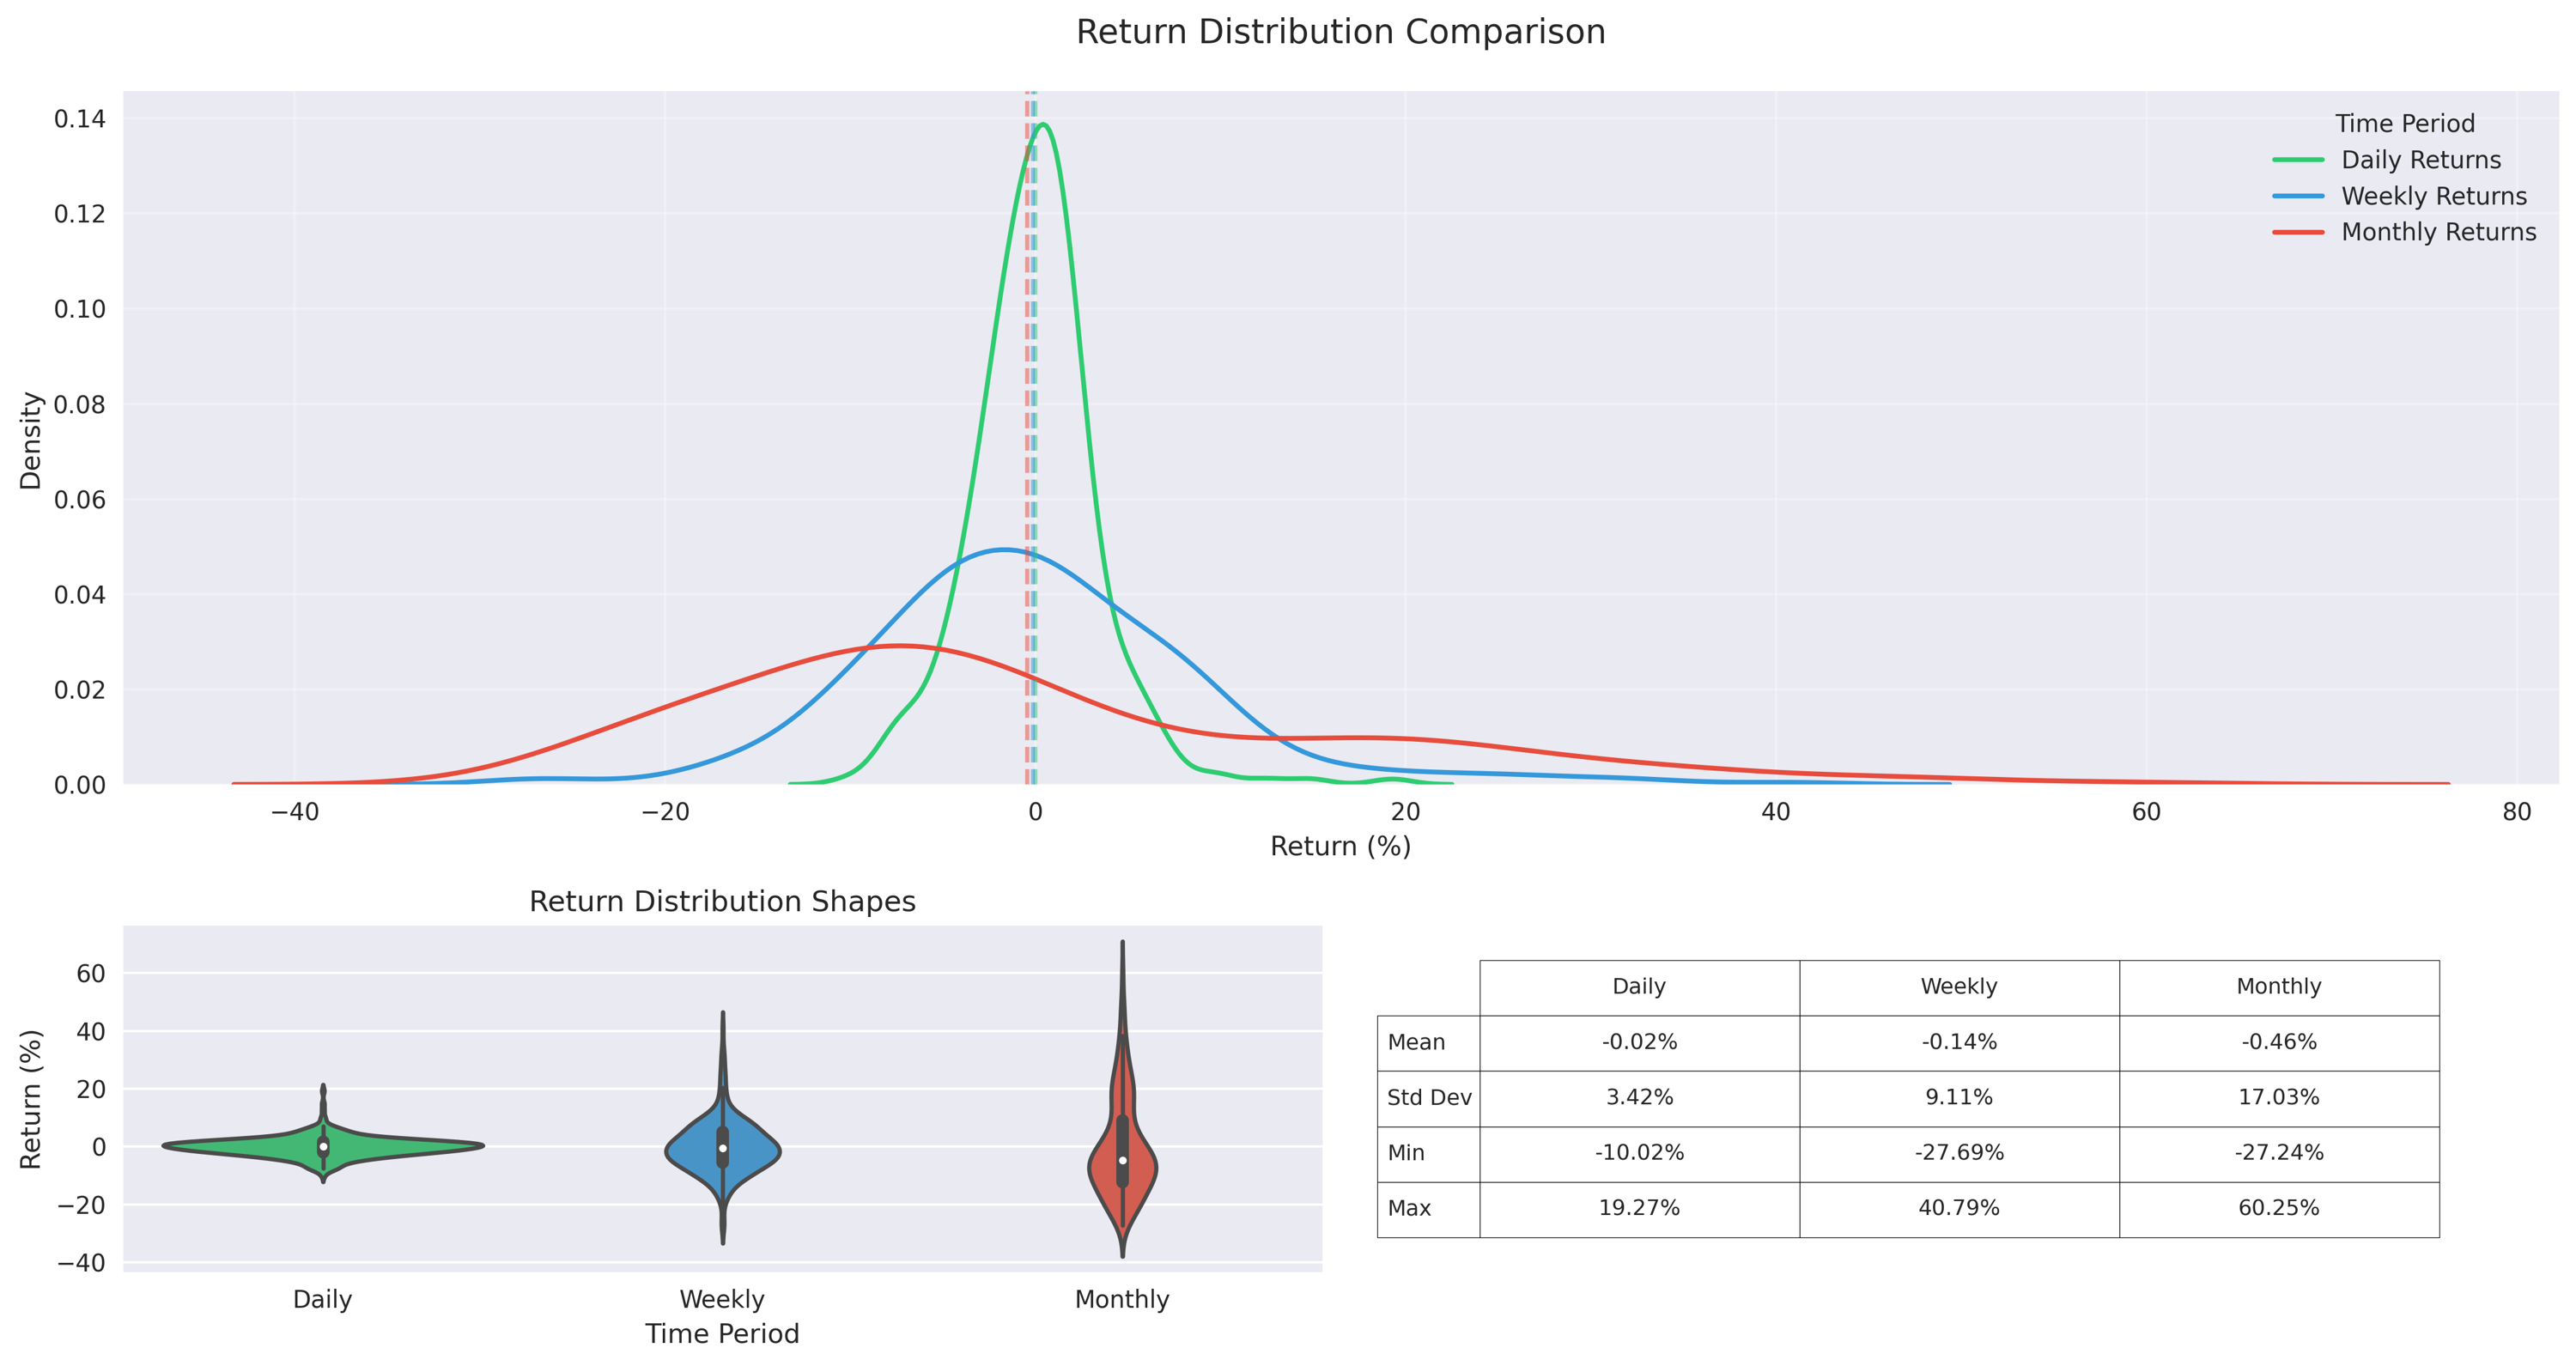
Predictive analysis shows high accuracy for daily trades with 1.73% error rate. Higher volatility in weekly predictions suggests better opportunities in day trading versus swing trading.

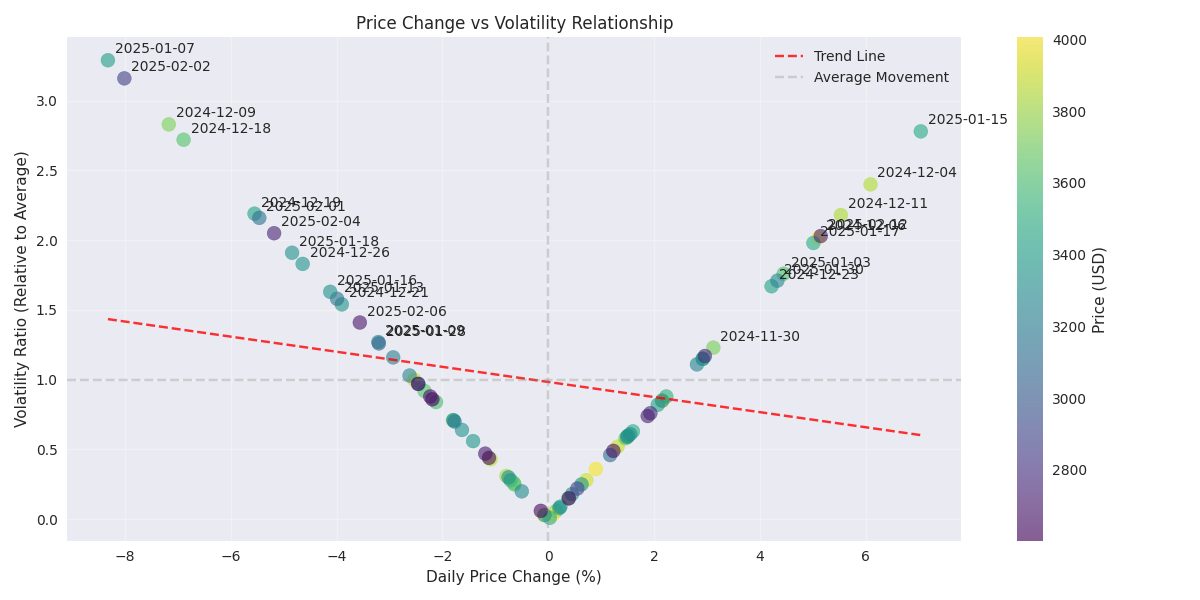
Recent Ethereum Price Analysis Shows High Volatility and Key Support Levels
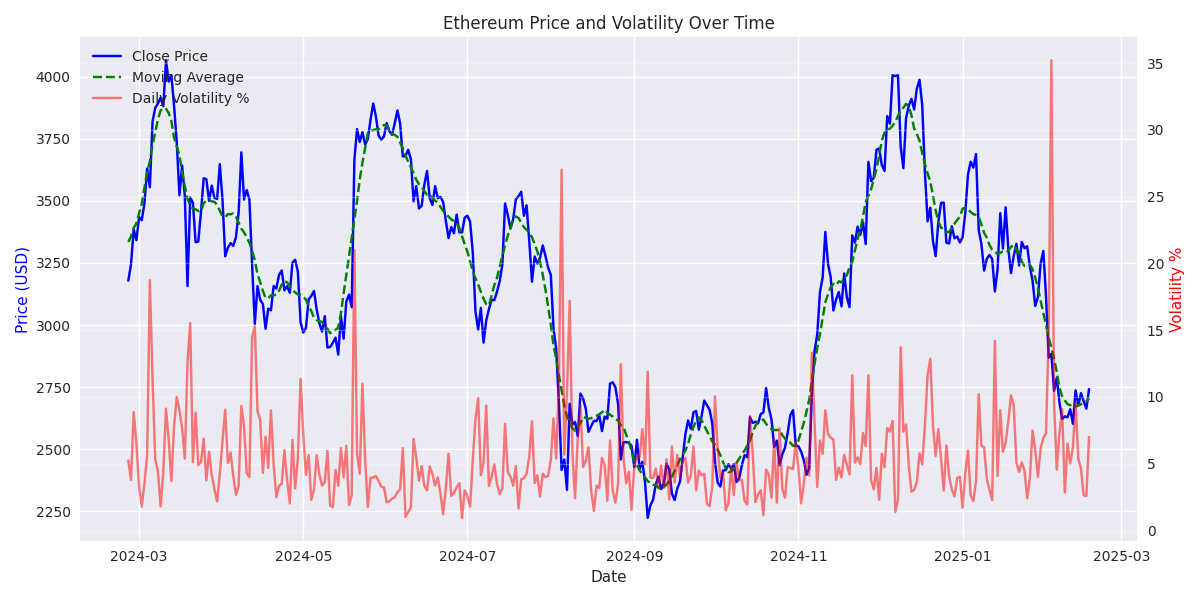
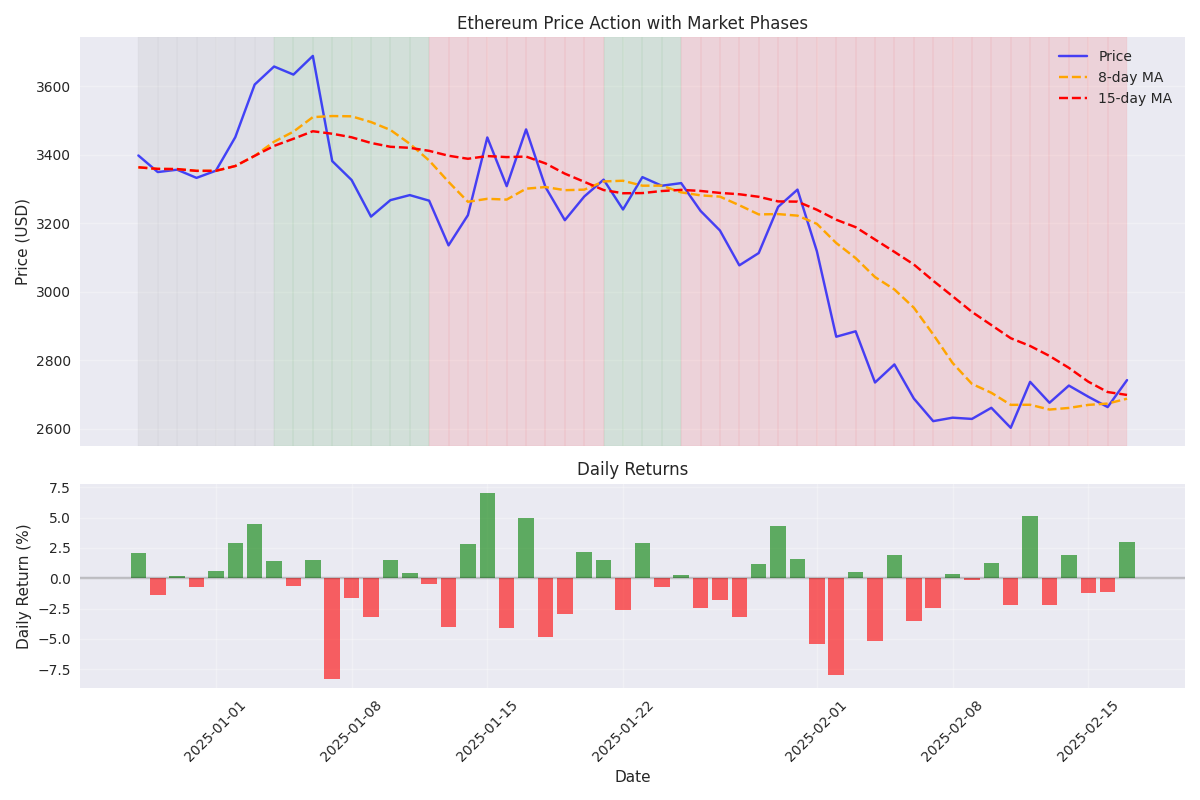
Recent Ethereum Price Analysis Shows Significant Market Correction and Stabilization
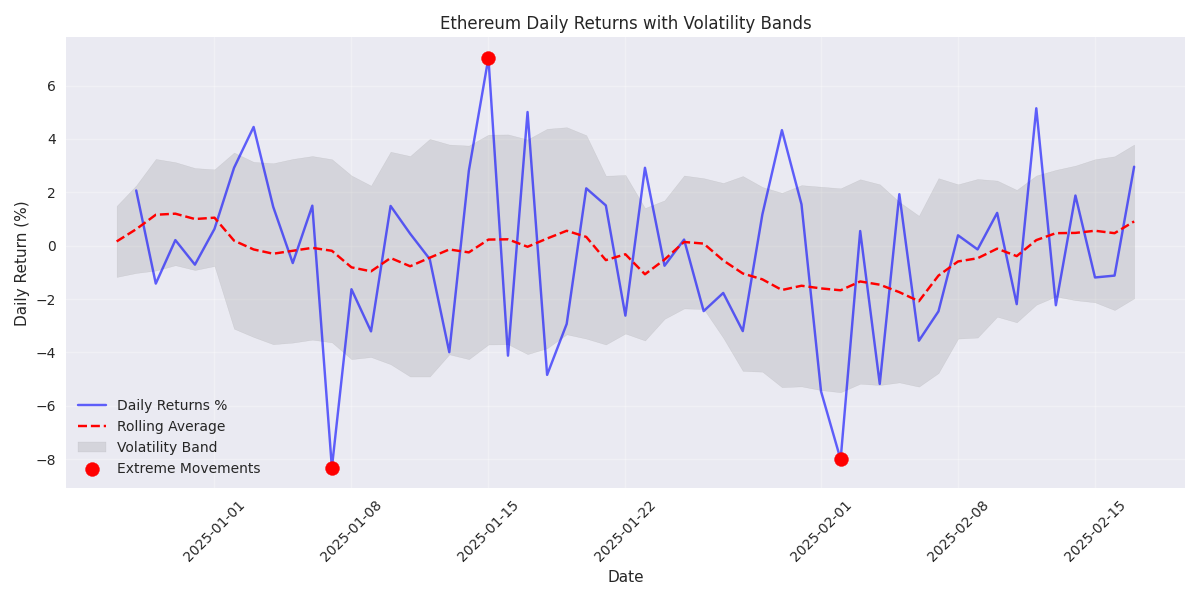
Volume Analysis Reveals Strong Market Participation During Price Movements
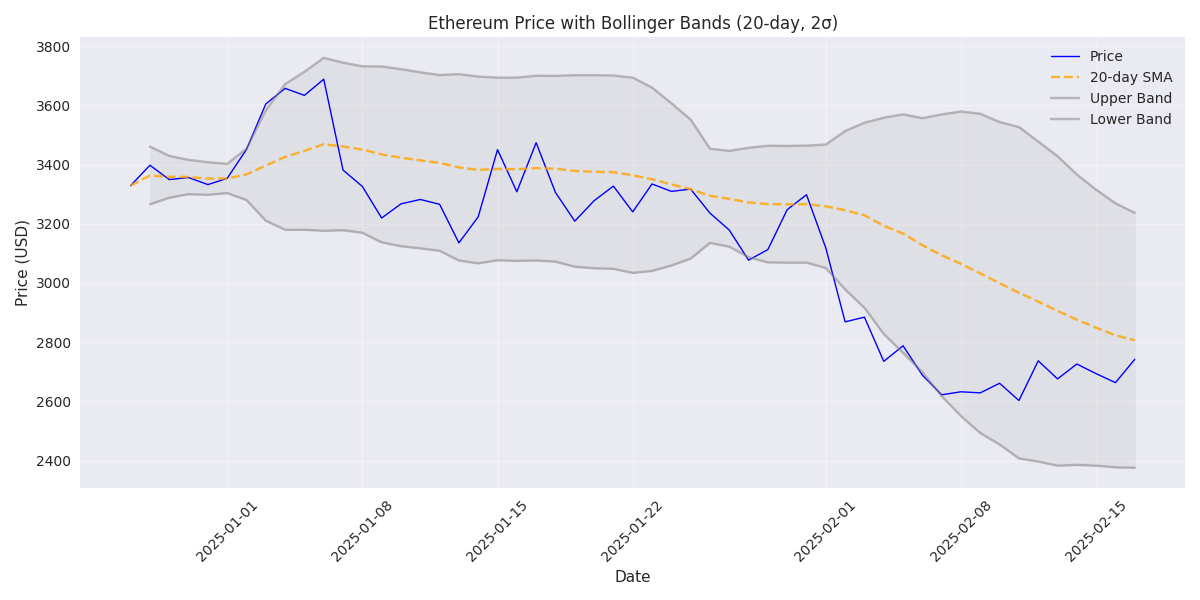
Technical Analysis Reveals Significant Market Transition and Support Levels
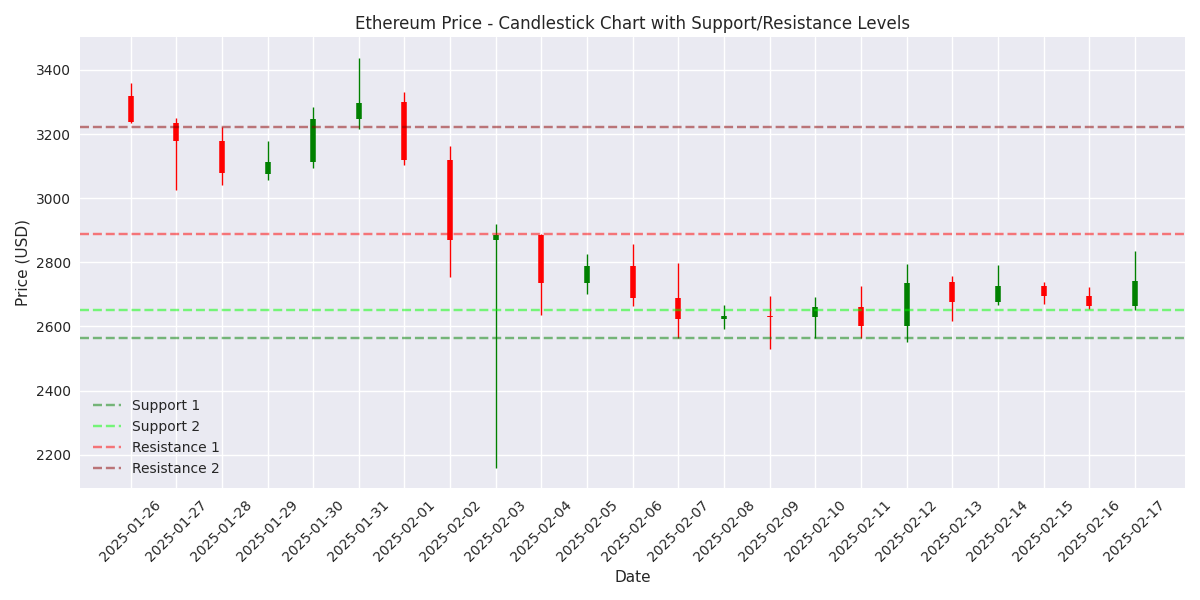
Initial Ethereum Price Movement Analysis Reveals Key Patterns