Natural Gas Market: Volatile Trends and Trader's Quick-Fire Predictions Revealed
Saving...
Natural Gas Shows Recovery Signs with Strong Volume Support
Saving...
Key Price Levels Set Trading Range for Natural Gas
Saving...
Winter Trading Offers Prime Opportunities in Natural Gas
Saving...
Trading Success Rates Highest in Stable Market Conditions
Saving...
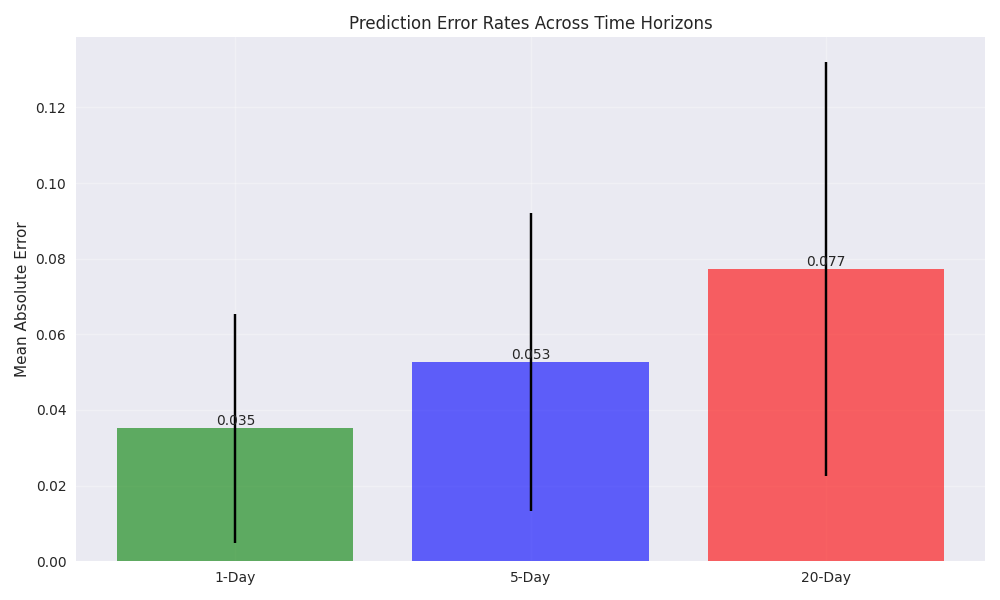
Medium-Term Trading Shows Superior Prediction Accuracy
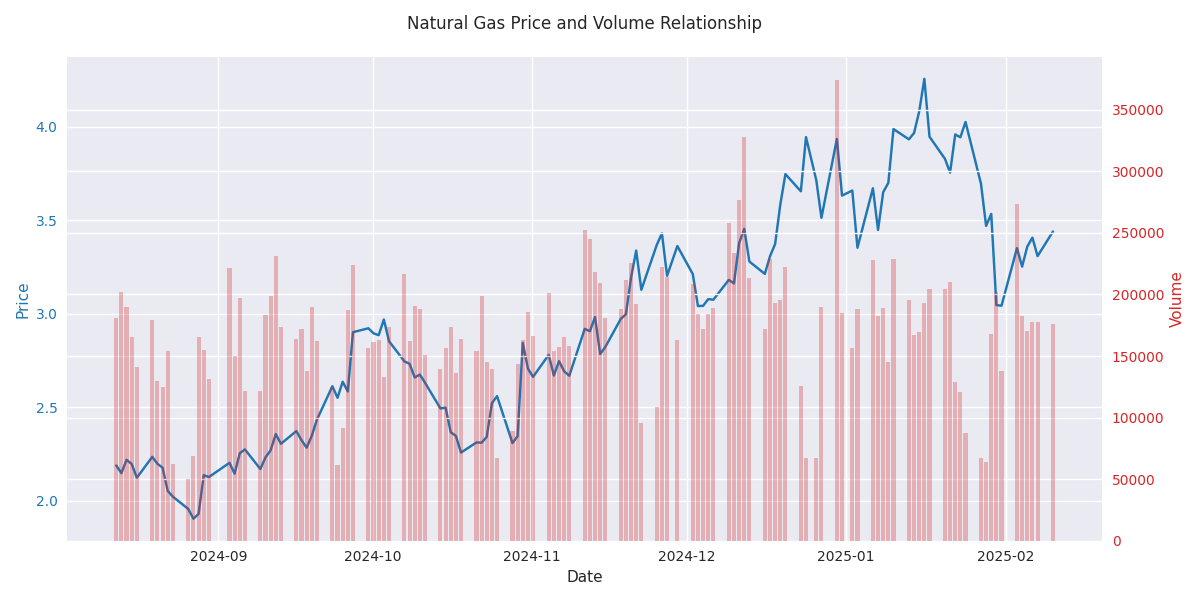
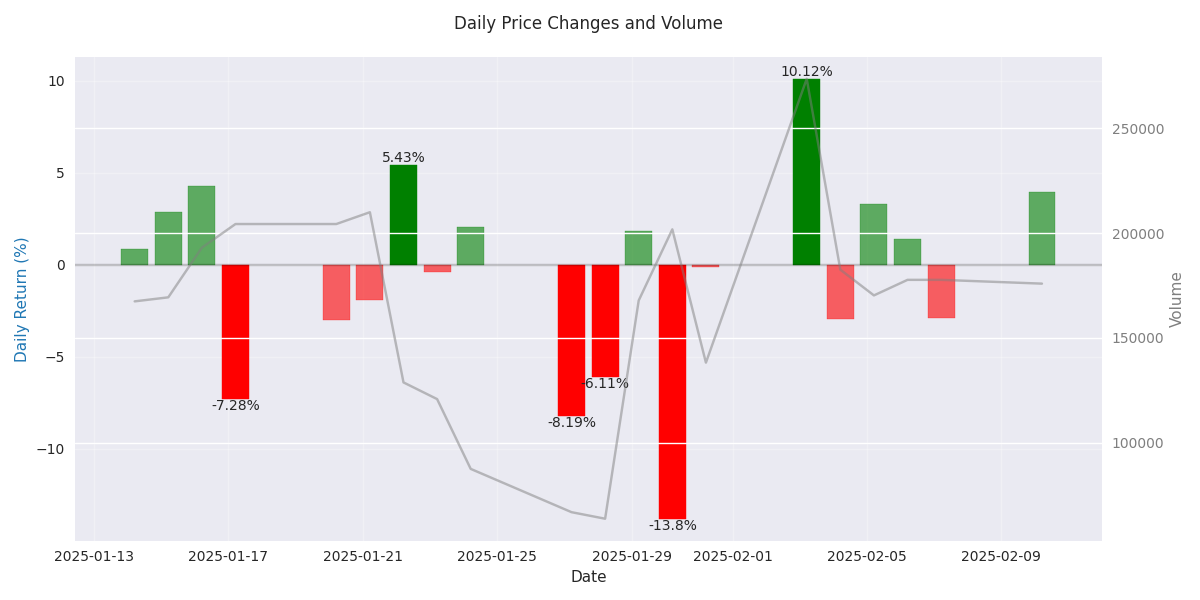
Natural Gas Price Analysis: Recent Price Trends and Volatility
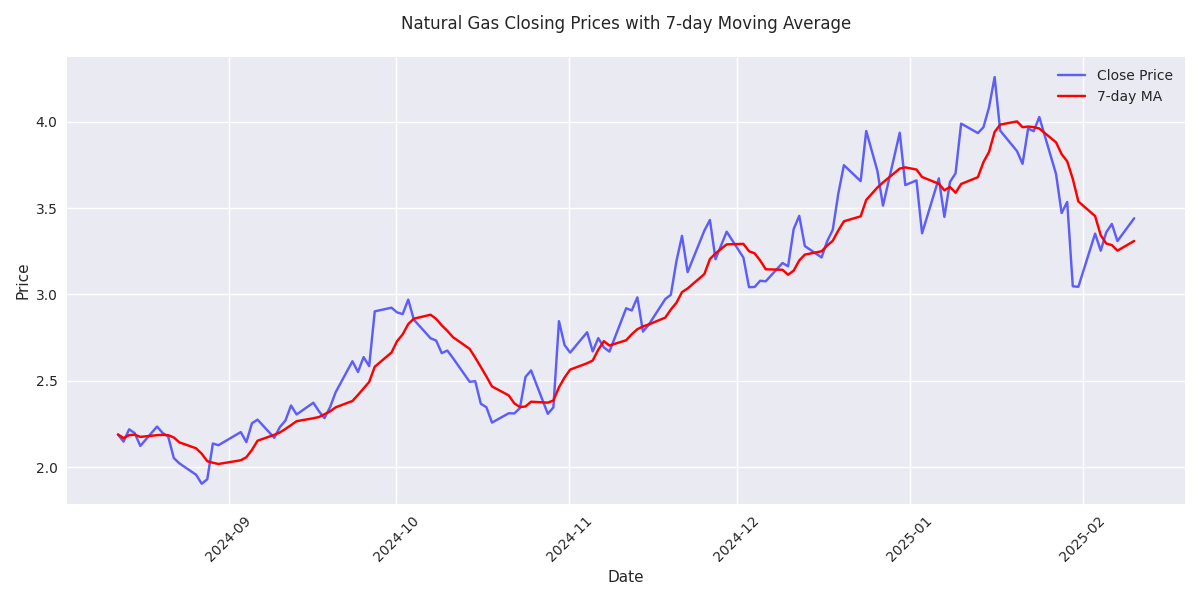
![Natural gas closing prices over the last 6 months with 7-day moving average showing the overall price trend and volatility. Natural gas closing prices over the last 6 months with 7-day moving average showing the overall price trend and volatility.](/assets/analysis/9e32d12a-f4a2-4daa-901f-c2816a1fa221//fd93cc40-722a-4a84-b8ae-55cce830e6ac.png)
Natural Gas Support and Resistance Analysis: Key Price Levels and Trading Opportunities
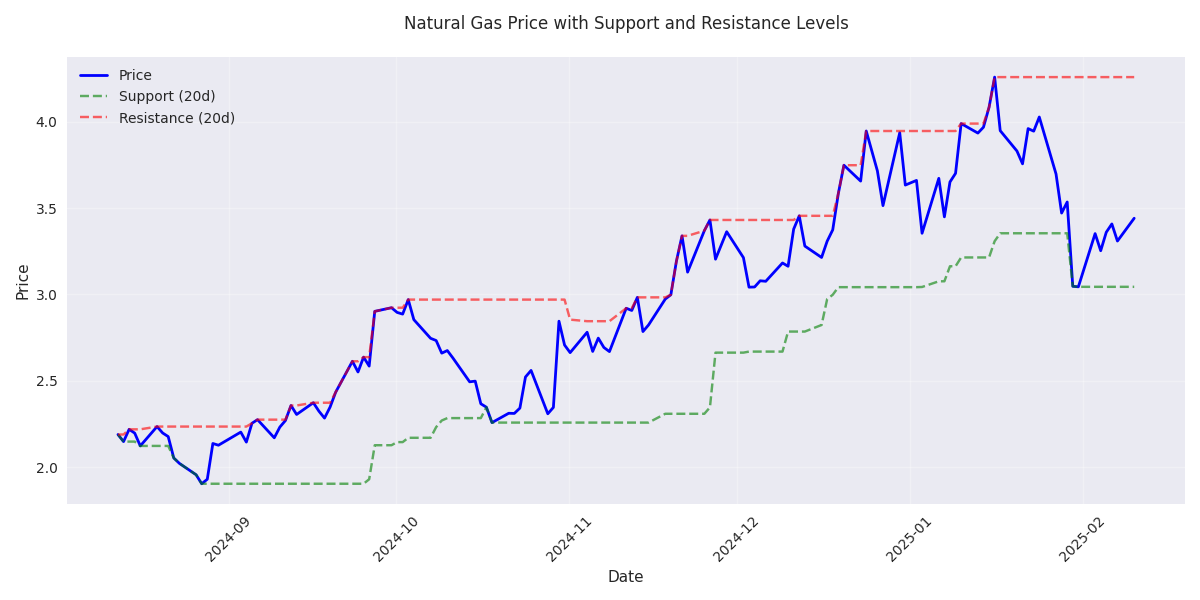
![Natural gas price movement with 20-day rolling support and resistance levels highlighting key trading zones. Natural gas price movement with 20-day rolling support and resistance levels highlighting key trading zones.](/assets/analysis/9e32d12a-f4a2-4daa-901f-c2816a1fa221//f9fd5126-d256-47c4-9c08-6c3389678f58.png)
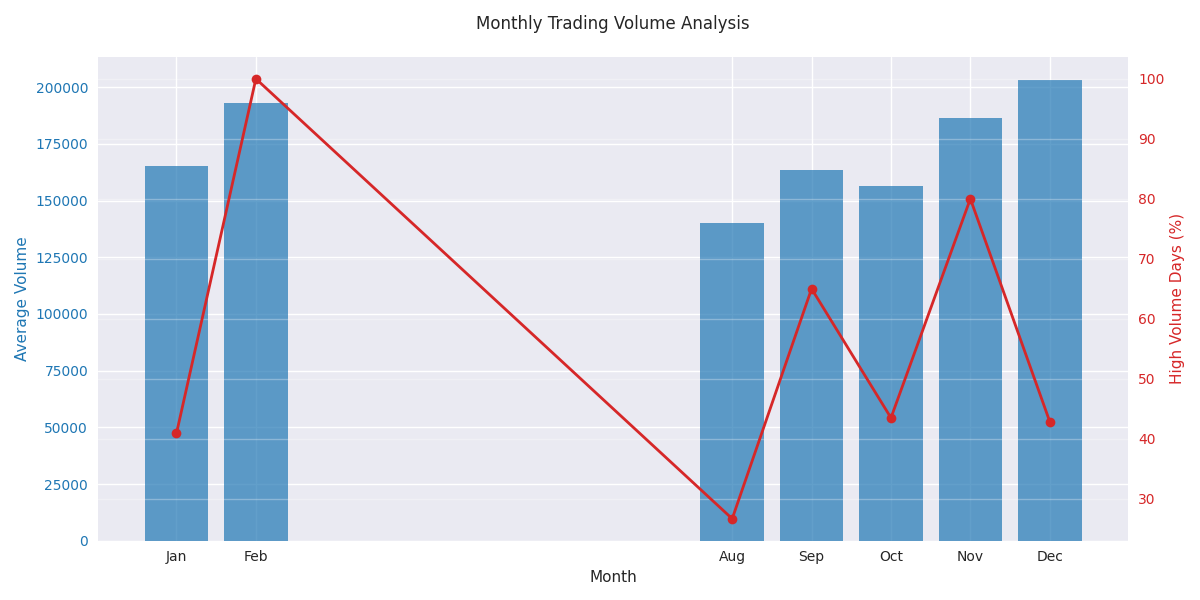
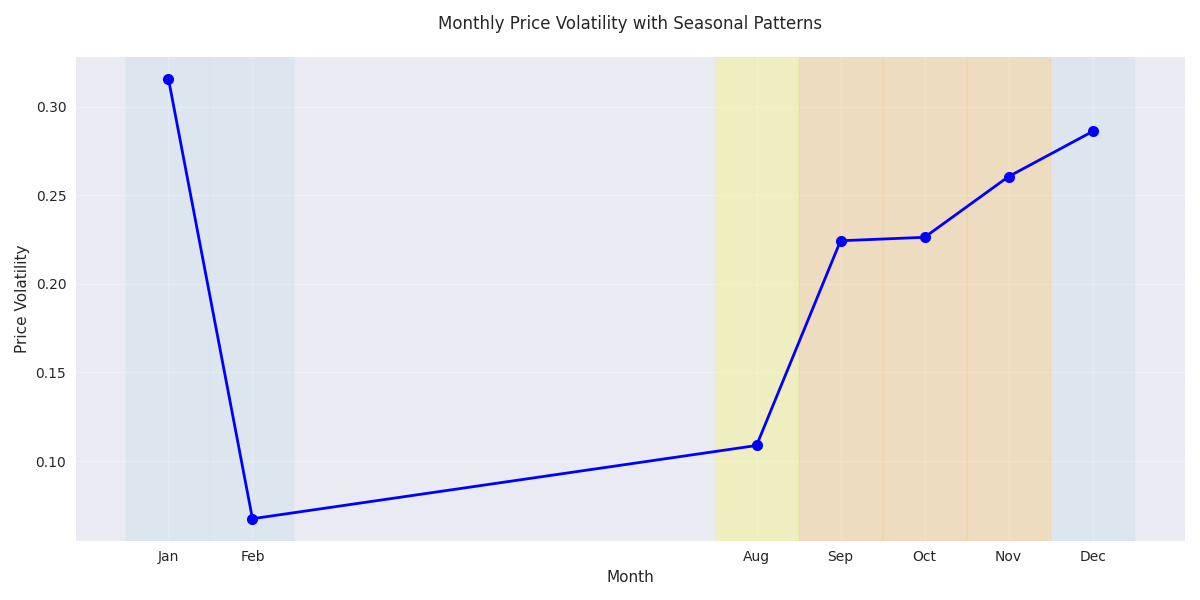
Natural Gas Seasonal Analysis: Monthly Price and Volume Patterns
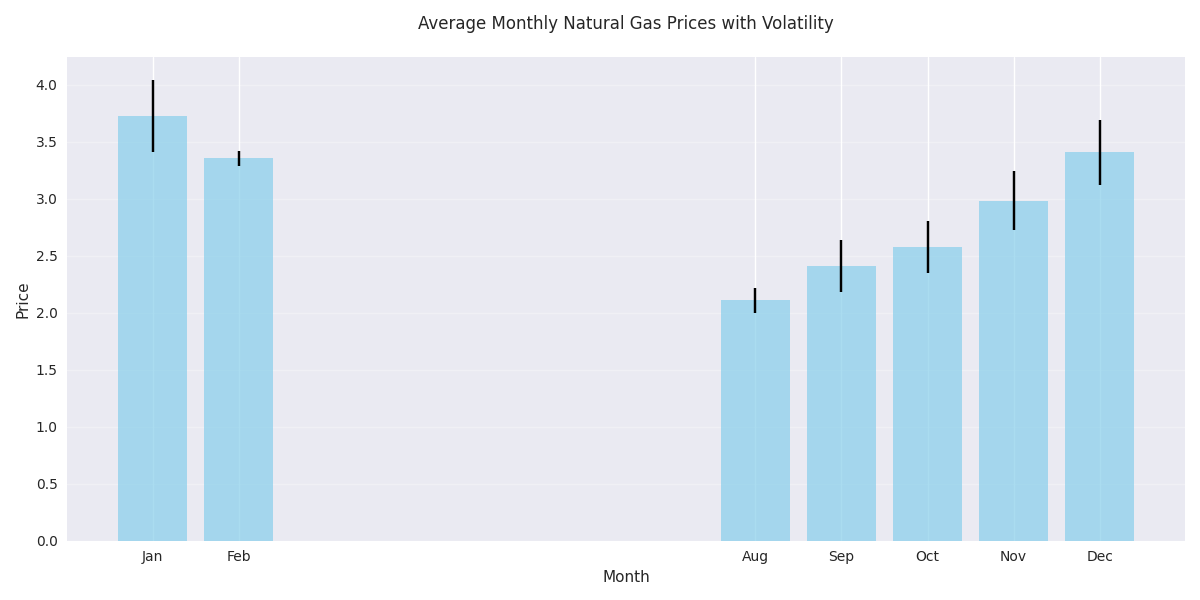
![Monthly average natural gas prices with volatility bars showing seasonal price patterns and risk levels. Monthly average natural gas prices with volatility bars showing seasonal price patterns and risk levels.](/assets/analysis/9e32d12a-f4a2-4daa-901f-c2816a1fa221//1c7ab128-7ff7-4b1b-b9cc-8c52ea45d1d4.png)
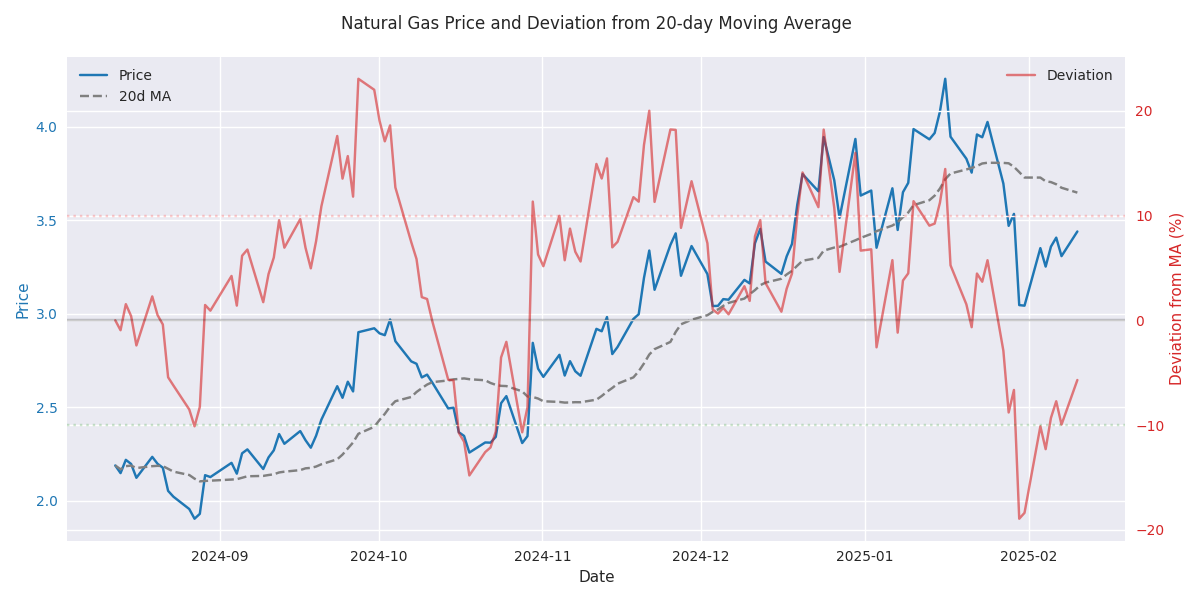
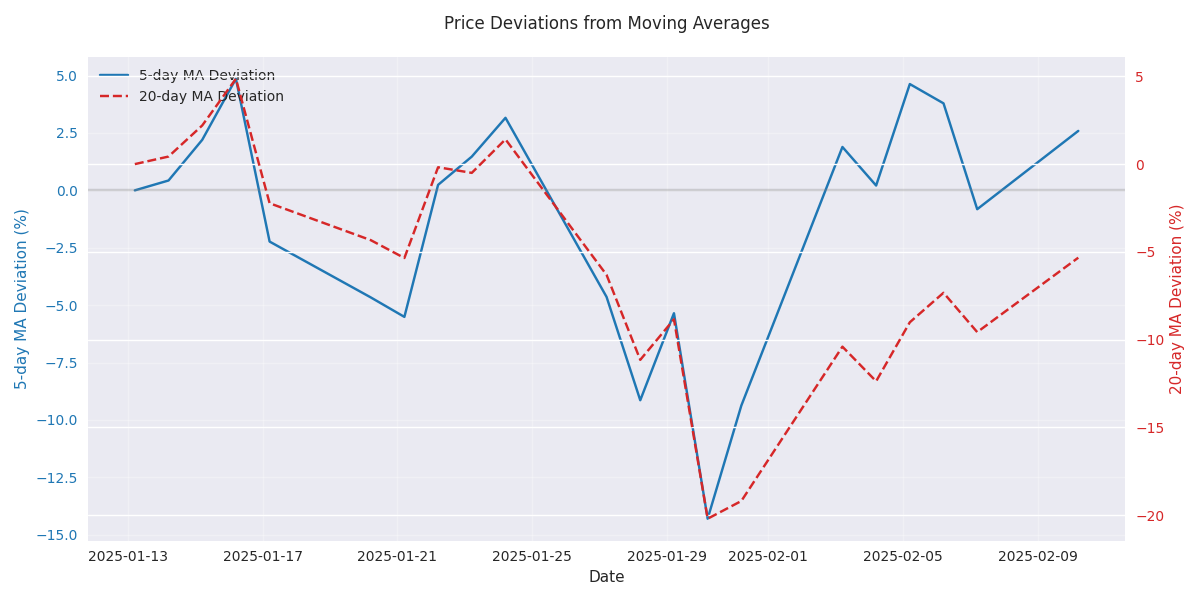
Recent Market Dynamics: Technical Analysis and Trading Signals
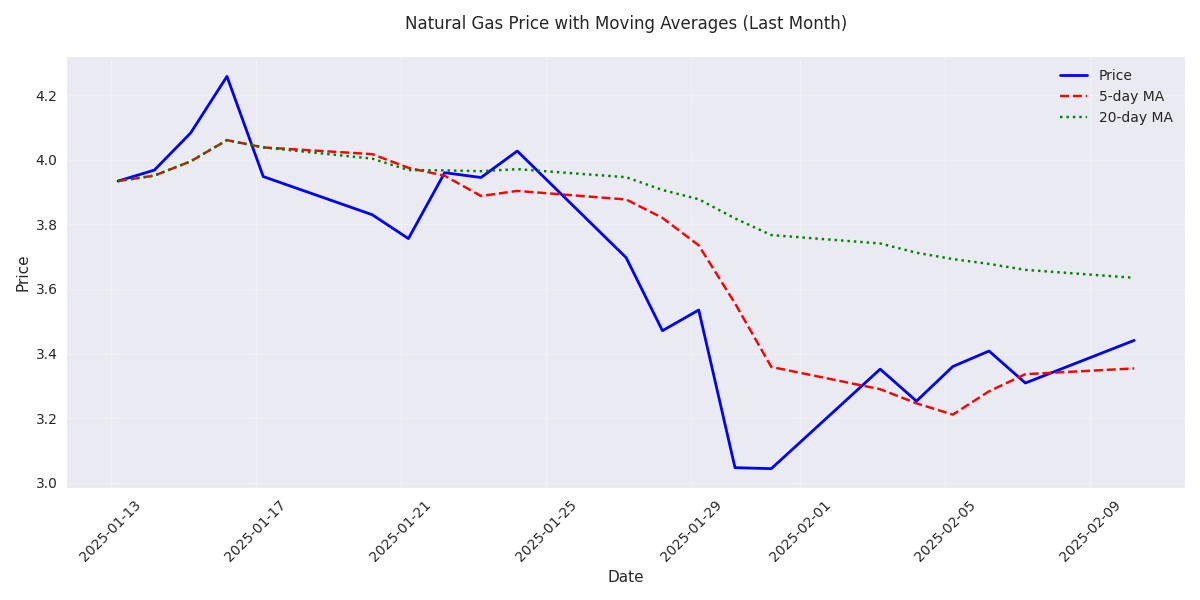
![Natural gas price trends with 5-day and 20-day moving averages showing recent trend changes and potential support/resistance levels. Natural gas price trends with 5-day and 20-day moving averages showing recent trend changes and potential support/resistance levels.](/assets/analysis/9e32d12a-f4a2-4daa-901f-c2816a1fa221//9f11dc39-4c14-4855-8d64-b9638494f5ab.png)
Short-term Natural Gas Price Prediction Analysis
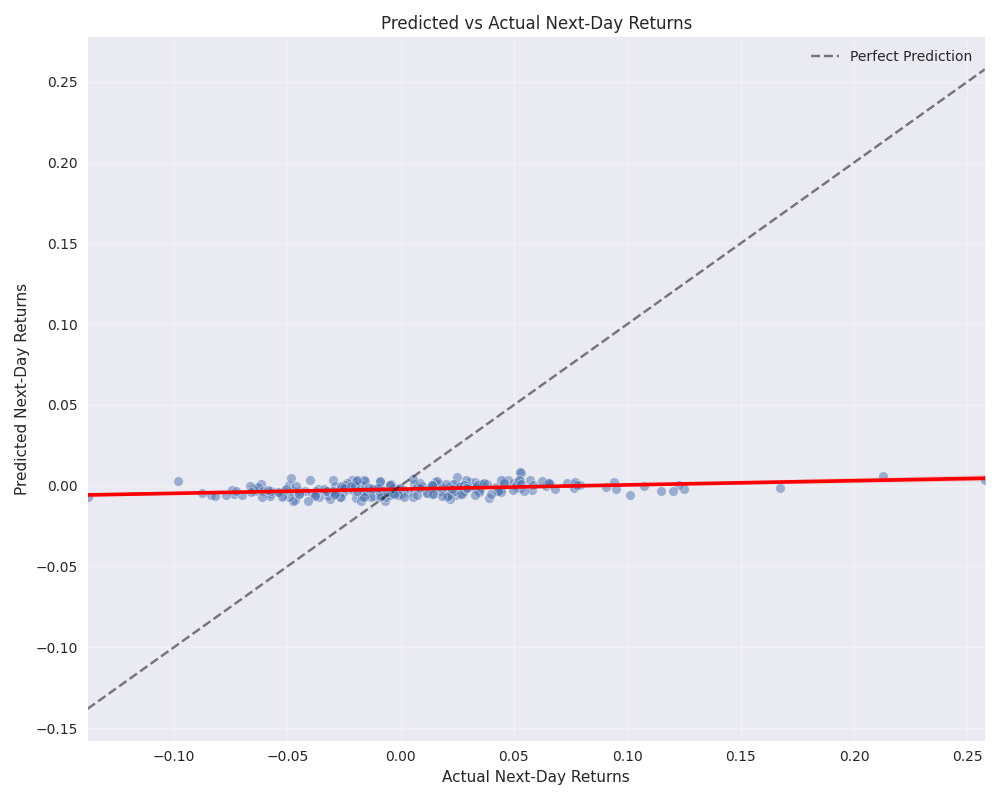
![Scatter plot comparing predicted vs actual next-day returns for natural gas prices, with regression line (red) showing model accuracy and perfect prediction line (dashed). Scatter plot comparing predicted vs actual next-day returns for natural gas prices, with regression line (red) showing model accuracy and perfect prediction line (dashed).](/assets/analysis/9e32d12a-f4a2-4daa-901f-c2816a1fa221//de1b16d7-7848-4d28-9b1e-194db9772619.png)
Medium-Term Natural Gas Price Prediction Analysis
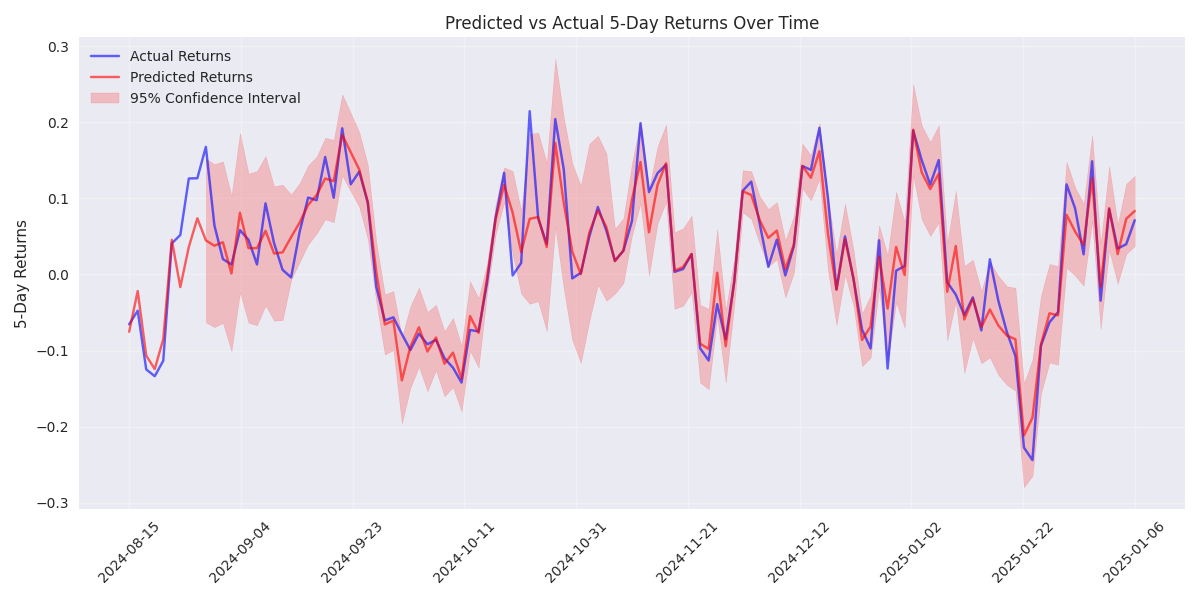
![Line plot comparing predicted (red) vs actual (blue) 5-day returns over time, with 95% confidence interval (shaded red area) based on rolling standard deviation of prediction errors. Line plot comparing predicted (red) vs actual (blue) 5-day returns over time, with 95% confidence interval (shaded red area) based on rolling standard deviation of prediction errors.](/assets/analysis/9e32d12a-f4a2-4daa-901f-c2816a1fa221//48b1a010-46e5-4472-a681-c7ce15c506a6.png)
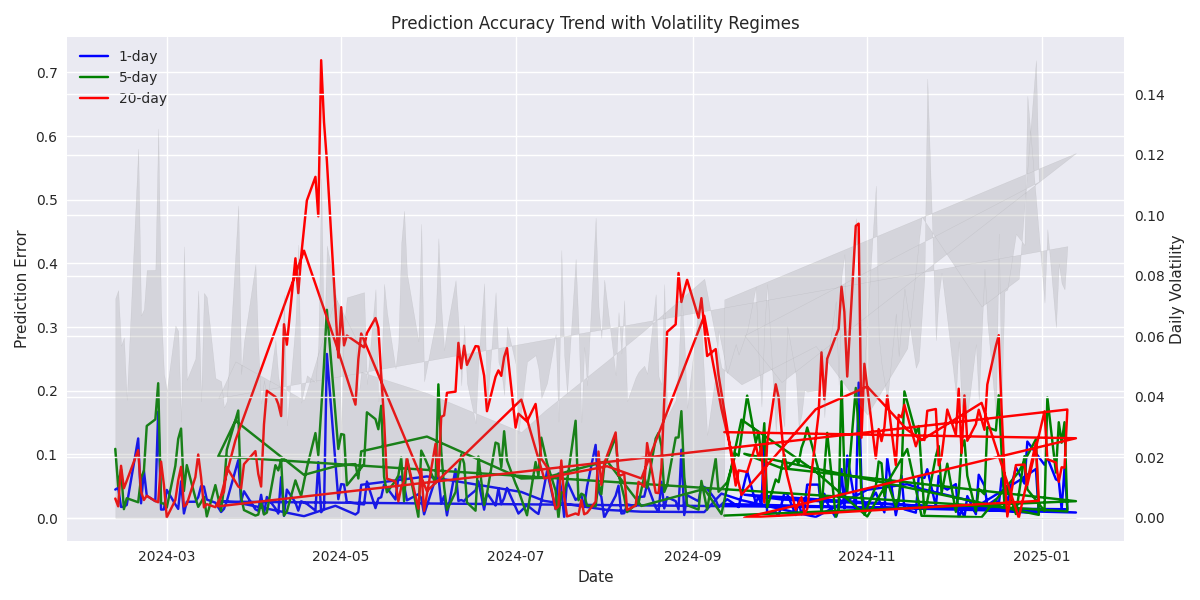
Long-term Natural Gas Price Prediction Analysis and Risk Assessment
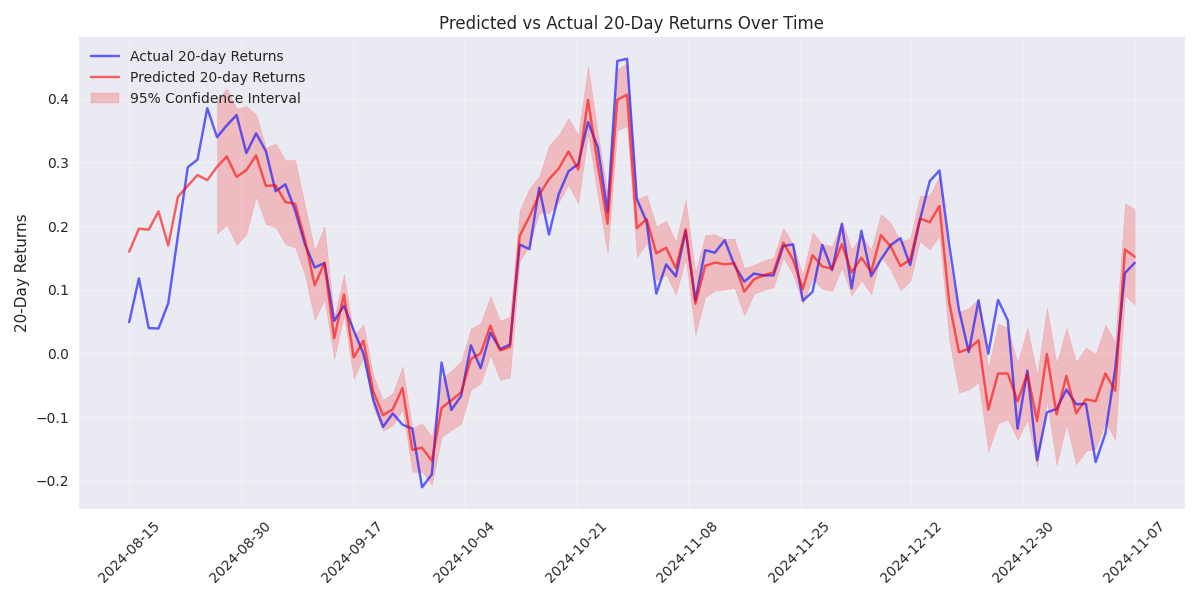
![Line plot comparing predicted (red) vs actual (blue) 20-day returns over time, with 95% confidence intervals (shaded red area) showing increasing uncertainty in longer-term predictions. Line plot comparing predicted (red) vs actual (blue) 20-day returns over time, with 95% confidence intervals (shaded red area) showing increasing uncertainty in longer-term predictions.](/assets/analysis/9e32d12a-f4a2-4daa-901f-c2816a1fa221//89751774-c357-480d-90da-4bf73b392514.png)
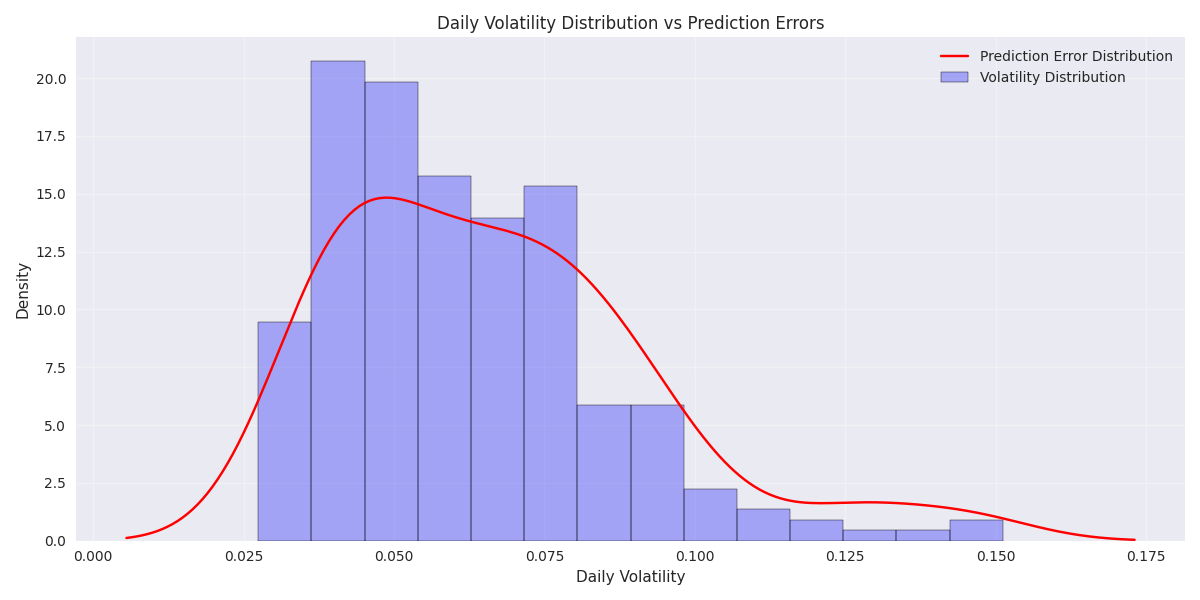
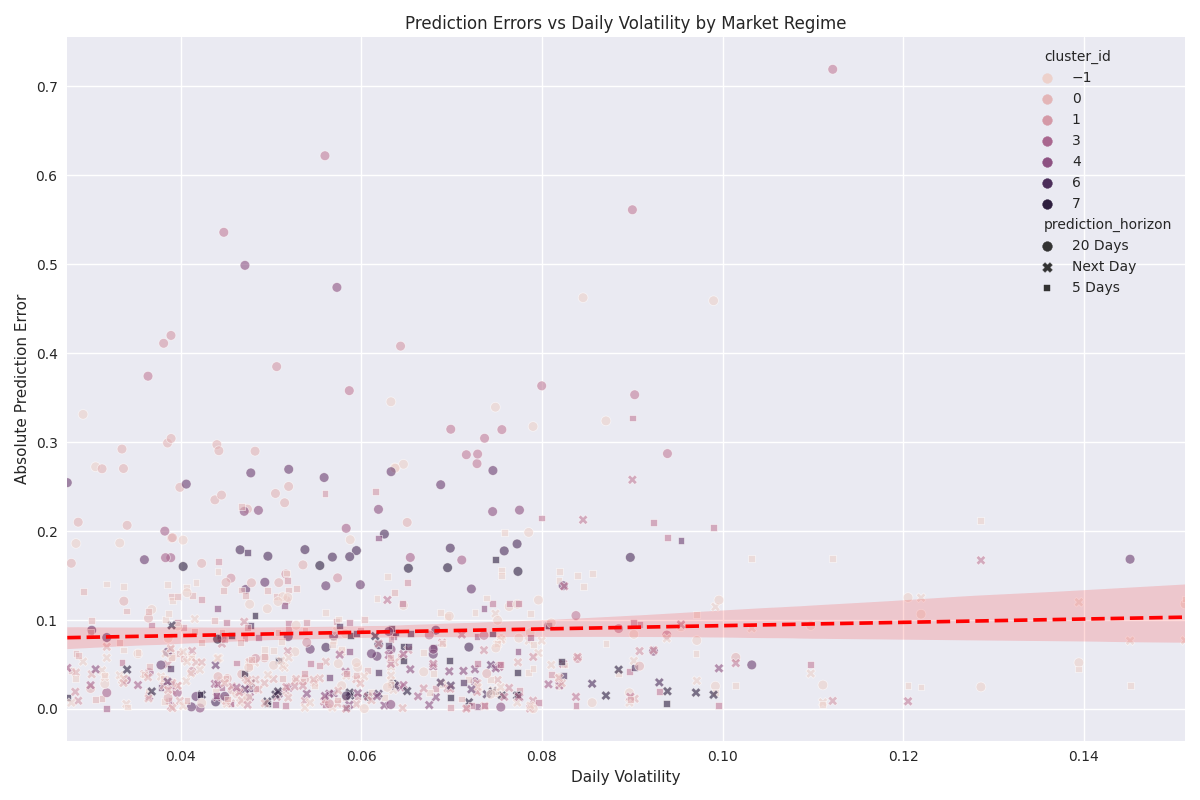
Market Volatility Regimes and Their Impact on Natural Gas Price Predictions
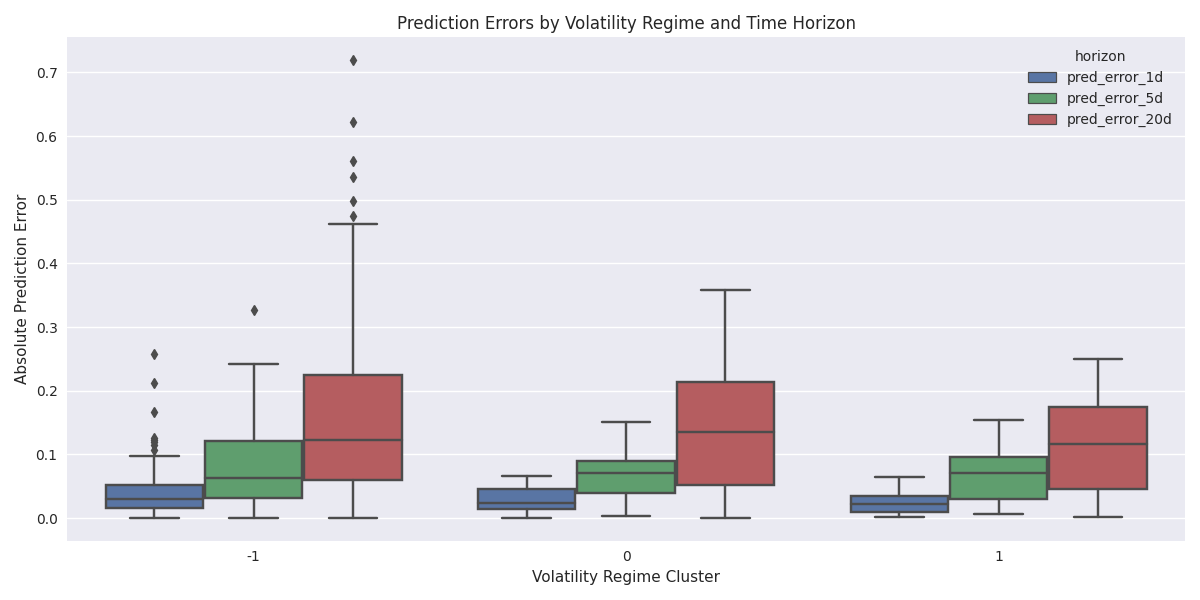
![Distribution of prediction errors across different volatility regimes and time horizons shows increasing uncertainty in higher volatility clusters. Distribution of prediction errors across different volatility regimes and time horizons shows increasing uncertainty in higher volatility clusters.](/assets/analysis/9e32d12a-f4a2-4daa-901f-c2816a1fa221//cf891752-8498-4df7-90fc-9ef00d496bdc.png)