Saving...
Breaking Down Copper's Market Moves: Urgent Trading Insights for Savvy Investors
Saving...
Saving...
Saving...
Saving...
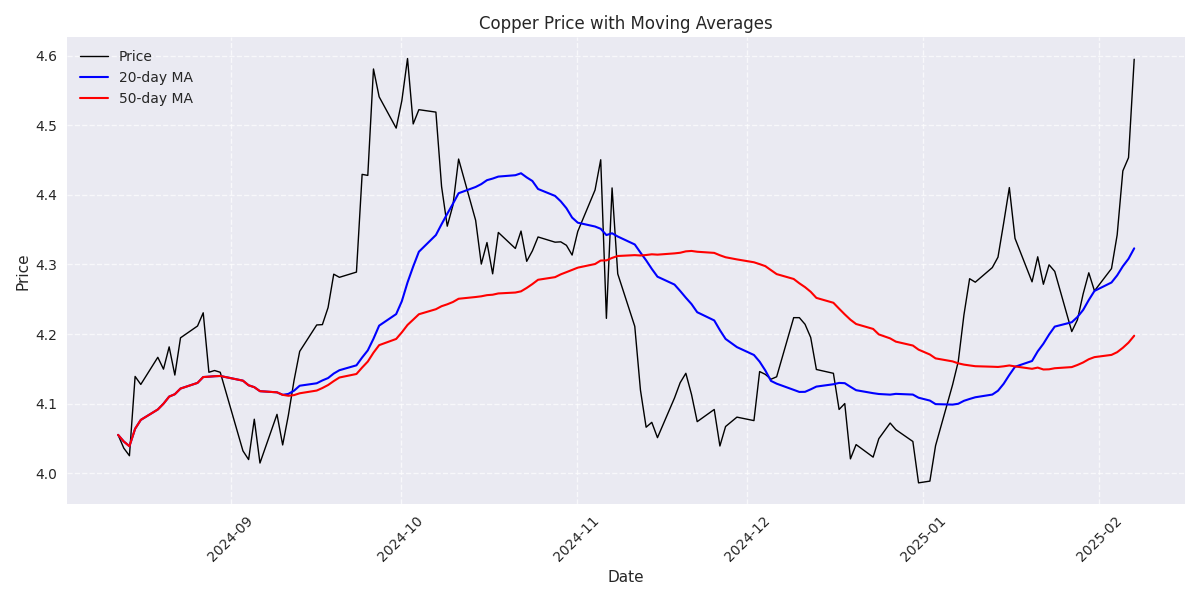
Recent Copper Price Trends Show Bullish Momentum with Significant Volume Spike
![Line chart showing copper prices (blue line) and trading volume (gray bars) over the last month, highlighting recent price surge and volume spike. Line chart showing copper prices (blue line) and trading volume (gray bars) over the last month, highlighting recent price surge and volume spike.](/assets/analysis/1201eb64-9756-489c-8cc9-df4de5756d59//084ff259-543c-4192-bbfc-98bd39711962.png)
Six-Month Analysis Reveals Increasing Price Stability and Volume Patterns
![Monthly price volatility (blue line) and average trading volume (red bars) over the last six months, showing recent volatility trends and volume surge. Monthly price volatility (blue line) and average trading volume (red bars) over the last six months, showing recent volatility trends and volume surge.](/assets/analysis/1201eb64-9756-489c-8cc9-df4de5756d59//0d71b00b-8e98-44ac-9c55-2651ae4c6f62.png)
Technical Analysis Reveals Strong Bullish Momentum and Key Trading Signals
![Copper price movement with 20-day and 50-day moving averages showing the golden cross and bullish momentum Copper price movement with 20-day and 50-day moving averages showing the golden cross and bullish momentum](/assets/analysis/1201eb64-9756-489c-8cc9-df4de5756d59//8dab880b-37f2-4bb6-b48f-09acab9287b2.png)
Volatility Analysis Shows Emerging Trading Opportunities with Risk Management Signals
![20-day rolling volatility trend with daily trading volume overlay showing recent market stability and volume patterns 20-day rolling volatility trend with daily trading volume overlay showing recent market stability and volume patterns](/assets/analysis/1201eb64-9756-489c-8cc9-df4de5756d59//cccb4f86-27bc-44cc-8f96-773253fa08f3.png)
Short-term Copper Price Prediction Analysis Reveals Strong Technical Indicators
![Comparison of actual copper prices against model predictions with 95% confidence intervals, showing the model's accuracy and uncertainty in price forecasting. Comparison of actual copper prices against model predictions with 95% confidence intervals, showing the model's accuracy and uncertainty in price forecasting.](/assets/analysis/1201eb64-9756-489c-8cc9-df4de5756d59//743993d3-214f-4ed5-8f4b-30185169e209.png)
Weekly Copper Price Forecast Shows Potential Trading Opportunities
![Comparison of actual copper prices (blue line) against predicted prices (red dashed line) with trading volume shown as bars, highlighting the relationship between price movements and trading activity. Comparison of actual copper prices (blue line) against predicted prices (red dashed line) with trading volume shown as bars, highlighting the relationship between price movements and trading activity.](/assets/analysis/1201eb64-9756-489c-8cc9-df4de5756d59//e78f8030-d496-4214-8090-79836229b433.png)
Long-term Copper Price Analysis Shows Stable Growth Potential
![Comparison of actual copper prices against monthly predicted prices with 95% confidence intervals, showing the predicted upward trend in prices. Comparison of actual copper prices against monthly predicted prices with 95% confidence intervals, showing the predicted upward trend in prices.](/assets/analysis/1201eb64-9756-489c-8cc9-df4de5756d59//ed50f574-cff7-41de-9841-6aa475eca379.png)