Corn Market Decoded: Traders' Quick Guide to Navigating Price Volatility
Recent Corn Price Analysis Shows Mixed Market Sentiment with Notable Volatility
![Daily closing prices and trading volume for corn commodity over the last 30 days showing recent price decline Daily closing prices and trading volume for corn commodity over the last 30 days showing recent price decline](/assets/analysis/75035cb6-56a4-436b-9f19-33cd57f2411a//0be35269-16c3-4f46-8bb2-b6ee7fdbf068.png)
Technical Analysis Reveals Bullish Momentum Despite Recent Price Decline
![Moving average analysis showing bullish trend with 5-day SMA above 14-day SMA Moving average analysis showing bullish trend with 5-day SMA above 14-day SMA](/assets/analysis/75035cb6-56a4-436b-9f19-33cd57f2411a//e289b69e-6cbe-4e76-ac5d-0a124a42ec12.png)
Volume Analysis Reveals Shifting Market Dynamics and Potential Price Support
![Price movement with volume deviation from 10-day average showing relationship between price action and trading activity Price movement with volume deviation from 10-day average showing relationship between price action and trading activity](/assets/analysis/75035cb6-56a4-436b-9f19-33cd57f2411a//1659444b-3053-4001-934e-b53499c8f83a.png)
Market Momentum Analysis Shows Potential Shift in Trend
![Price movement with 14-day SMA overlay and momentum indicator showing recent bearish divergence Price movement with 14-day SMA overlay and momentum indicator showing recent bearish divergence](/assets/analysis/75035cb6-56a4-436b-9f19-33cd57f2411a//b90b1930-b5cb-46f3-b2cc-2ff117e8a1af.png)
Initial Corn Price Prediction Model Shows Strong Performance with Key Technical Indicators
![Comparison of actual vs predicted corn prices over time, with confidence intervals based on 20-day volatility Comparison of actual vs predicted corn prices over time, with confidence intervals based on 20-day volatility](/assets/analysis/75035cb6-56a4-436b-9f19-33cd57f2411a//82ab5e62-25dd-4dff-8741-e5f23d081364.png)
Multi-Horizon Corn Price Predictions Show Increasing Uncertainty
![Time series plot showing actual corn prices, predicted prices, and confidence intervals based on market volatility Time series plot showing actual corn prices, predicted prices, and confidence intervals based on market volatility](/assets/analysis/75035cb6-56a4-436b-9f19-33cd57f2411a//131944ea-2204-4c09-a235-ca67b4e02e81.png)
Monthly Corn Price Forecasts Show Stable Trend with Moderate Volatility
![Comparison of actual vs predicted monthly corn prices with 95% confidence intervals showing prediction uncertainty Comparison of actual vs predicted monthly corn prices with 95% confidence intervals showing prediction uncertainty](/assets/analysis/75035cb6-56a4-436b-9f19-33cd57f2411a//06a14caf-5463-4b5b-a792-203c78c36d4b.png)
Corn Price Predictions Show High Accuracy with Key Risk Patterns
![Scatter plot showing prediction errors across different time horizons with trend lines Scatter plot showing prediction errors across different time horizons with trend lines](/assets/analysis/75035cb6-56a4-436b-9f19-33cd57f2411a//5feda5ed-a4fd-4d5c-9301-b8656110905e.png)
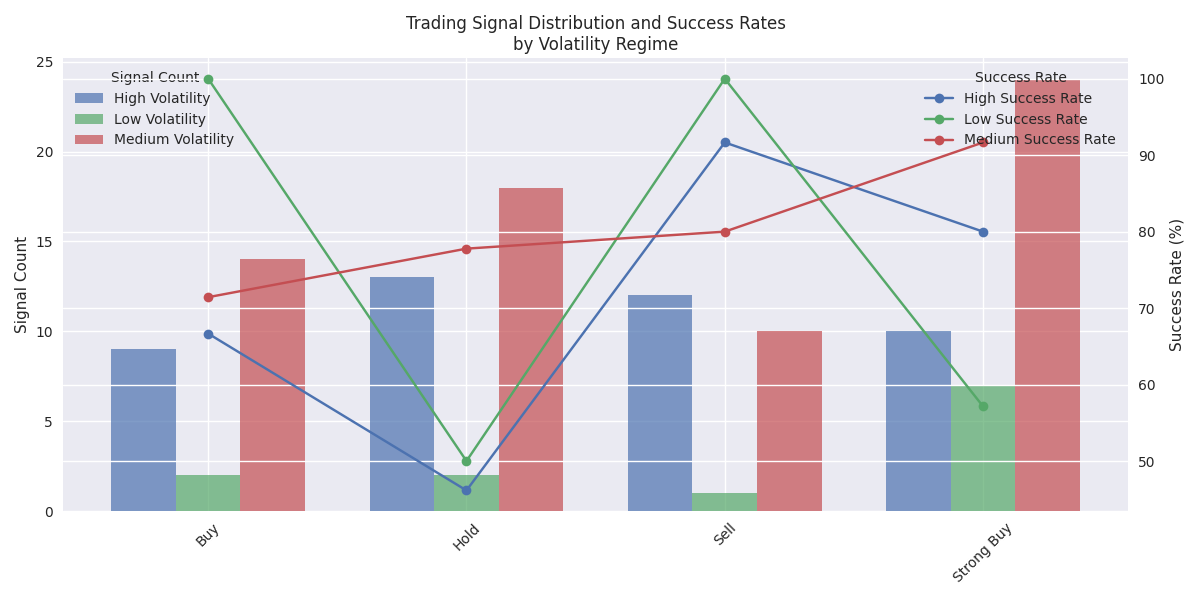
Trading Signals Analysis Reveals Optimal Market Entry Points
![Distribution of trading signals and their success rates across different volatility regimes Distribution of trading signals and their success rates across different volatility regimes](/assets/analysis/75035cb6-56a4-436b-9f19-33cd57f2411a//b9af09a3-ffda-469a-a59f-690e035eb426.png)