Breaking Down Intel's Market Moves: Urgent Trading Insights for Savvy Investors
Saving...
High-Confidence Bearish Signal for Intel Stock
Saving...
Clear Trading Range Identified with Strong Technical Setup
Saving...
Potential Reversal Signal Despite Bearish Trend
Saving...
Limited Institutional Support Adds Pressure
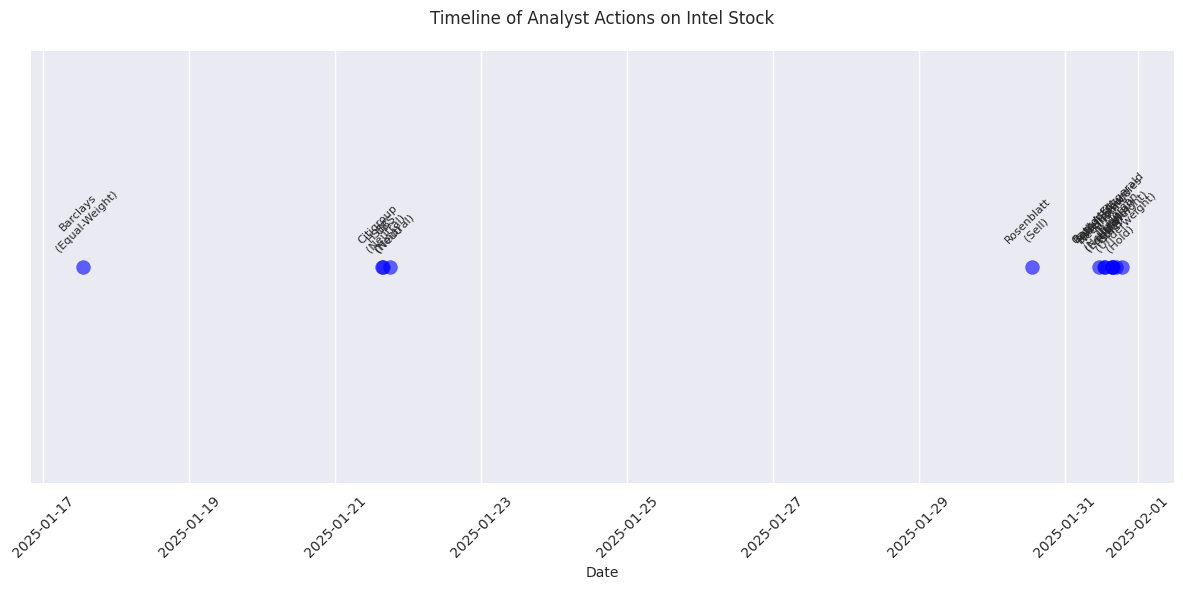
Intel Stock Analysis: Price Movement and Analyst Sentiment
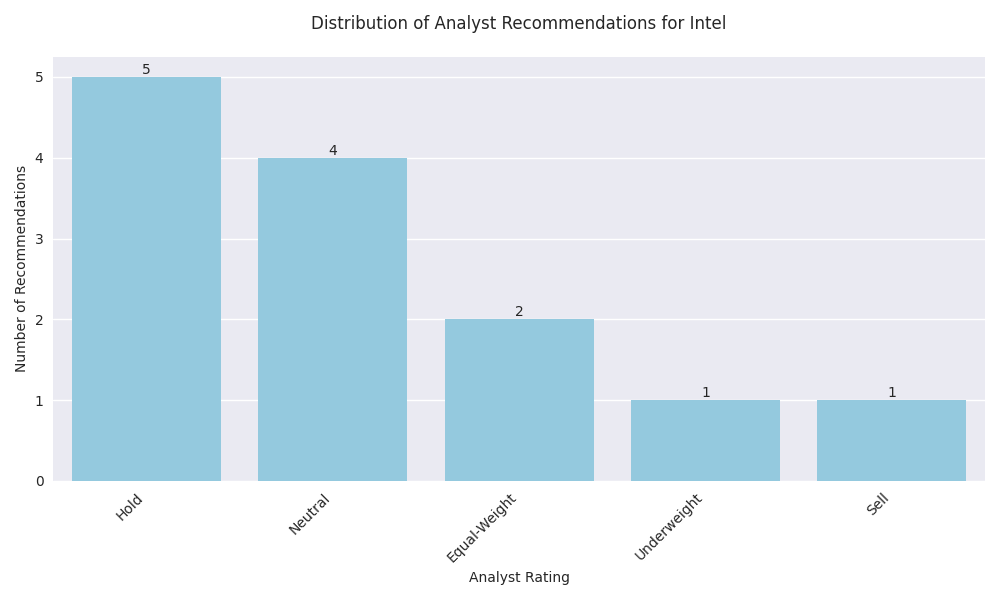
![Distribution of analyst recommendations for Intel over the past month showing the concentration of different ratings. Distribution of analyst recommendations for Intel over the past month showing the concentration of different ratings.](/assets/analysis/2efd225d-40a0-4525-bc8a-34473bbc797c//e4d12a6e-7d55-4611-b2d4-8b304ad748b5.png)
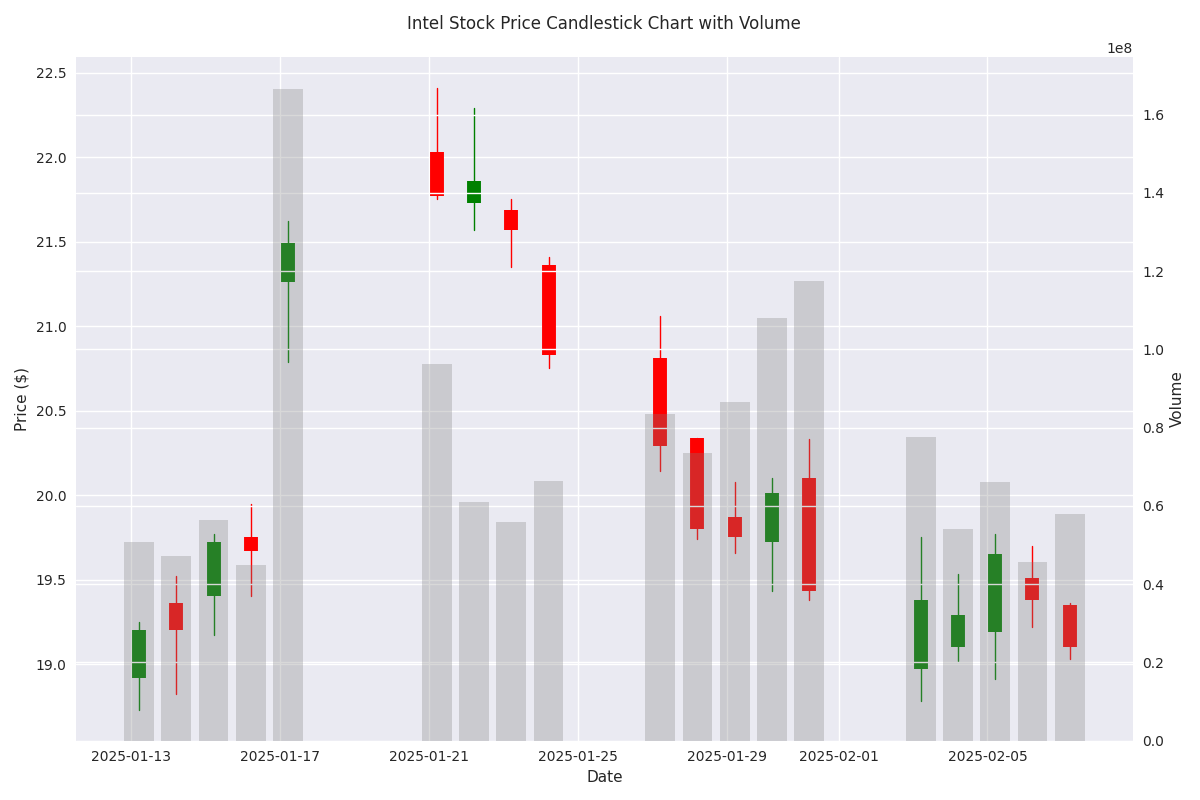
Intel's Technical Analysis: Support, Resistance, and Price Action
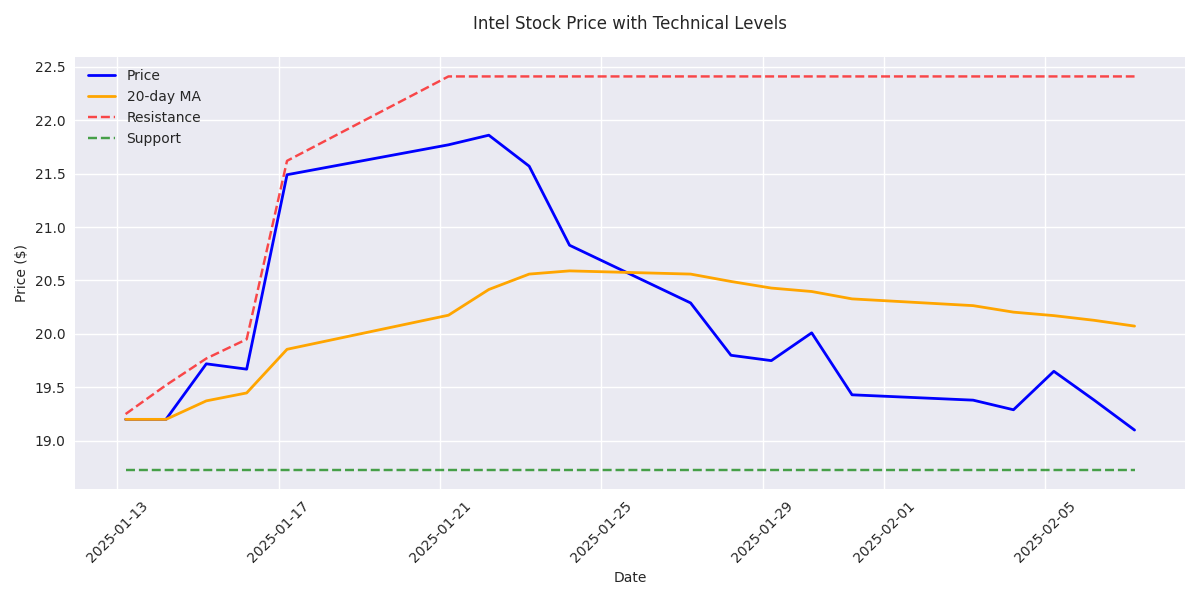
![Intel stock price movement with 20-day moving average and key support/resistance levels over the past month. Intel stock price movement with 20-day moving average and key support/resistance levels over the past month.](/assets/analysis/2efd225d-40a0-4525-bc8a-34473bbc797c//a790f072-2b22-440f-9ccd-1371e9b43892.png)
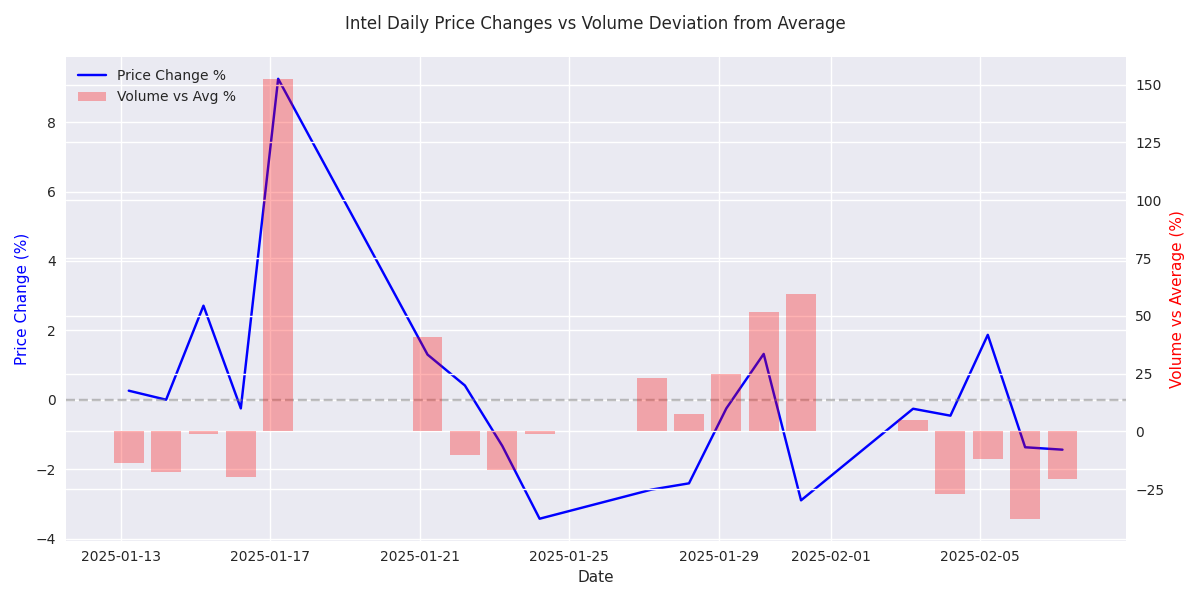
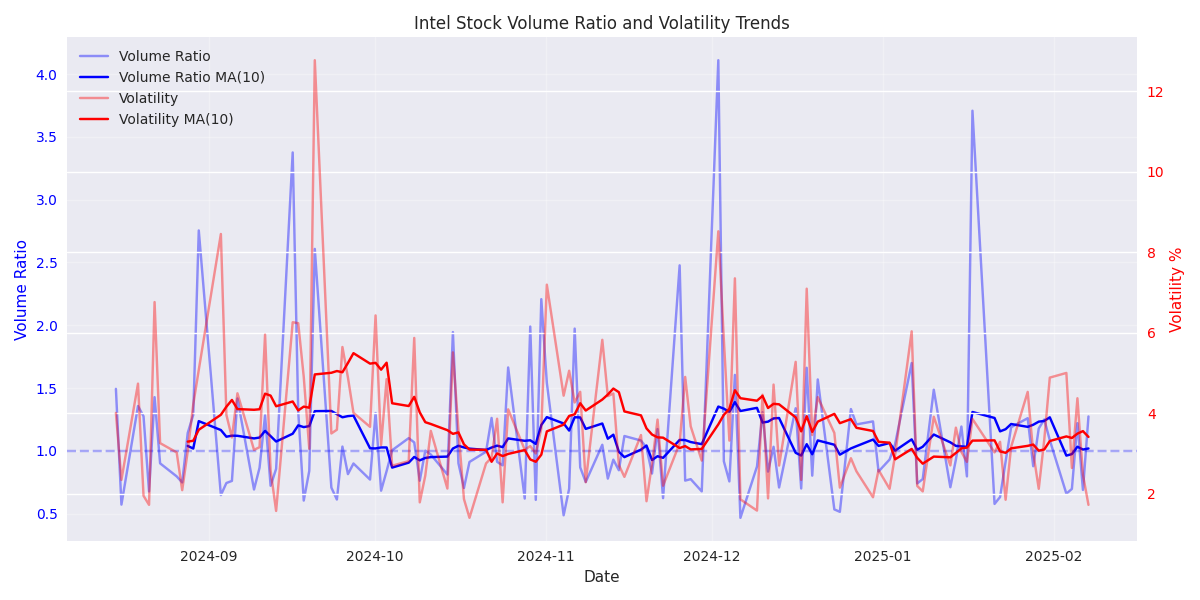
Intel's Recent Price Performance and Volume Analysis
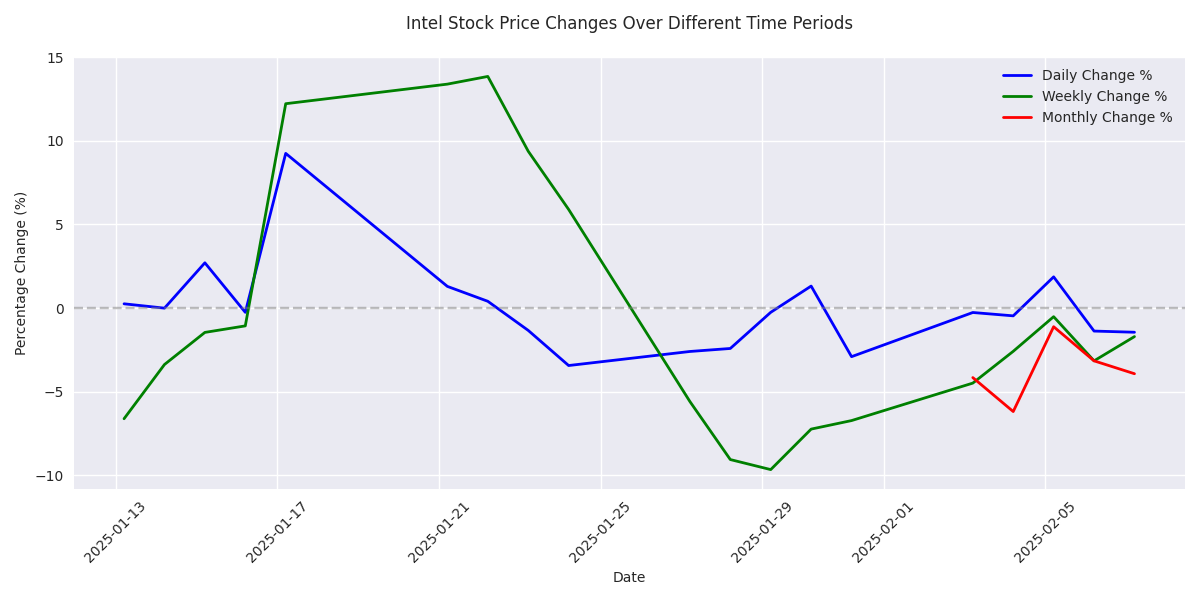
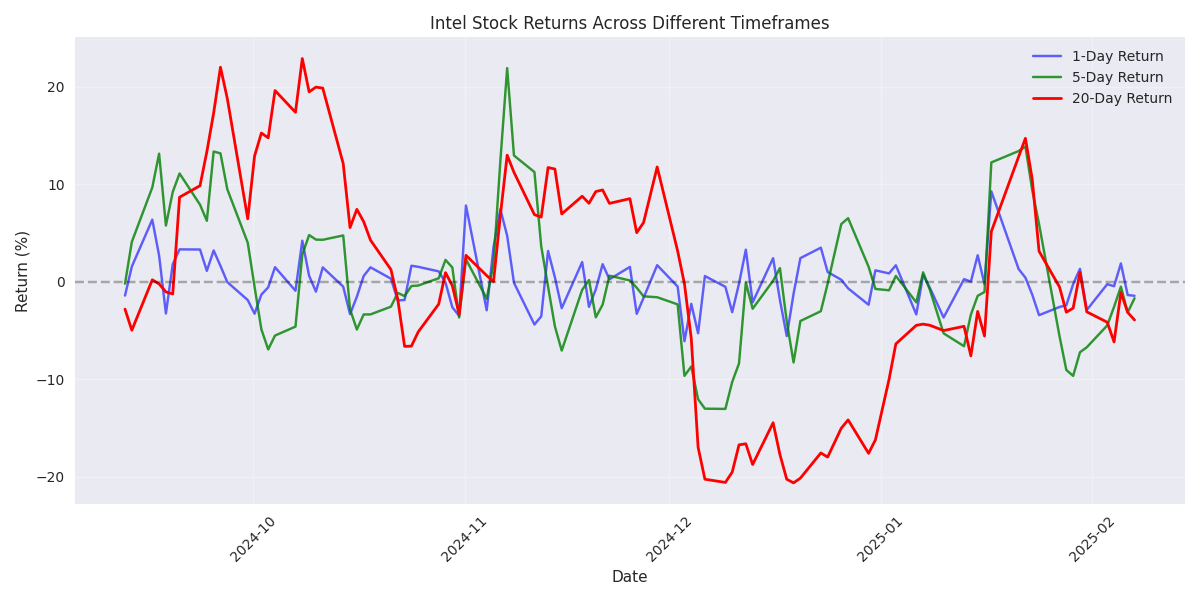
![Comparison of Intel's daily, weekly, and monthly price changes showing trend consistency across different timeframes. Comparison of Intel's daily, weekly, and monthly price changes showing trend consistency across different timeframes.](/assets/analysis/2efd225d-40a0-4525-bc8a-34473bbc797c//6c416592-a20d-4c31-a488-835998a9b2ea.png)
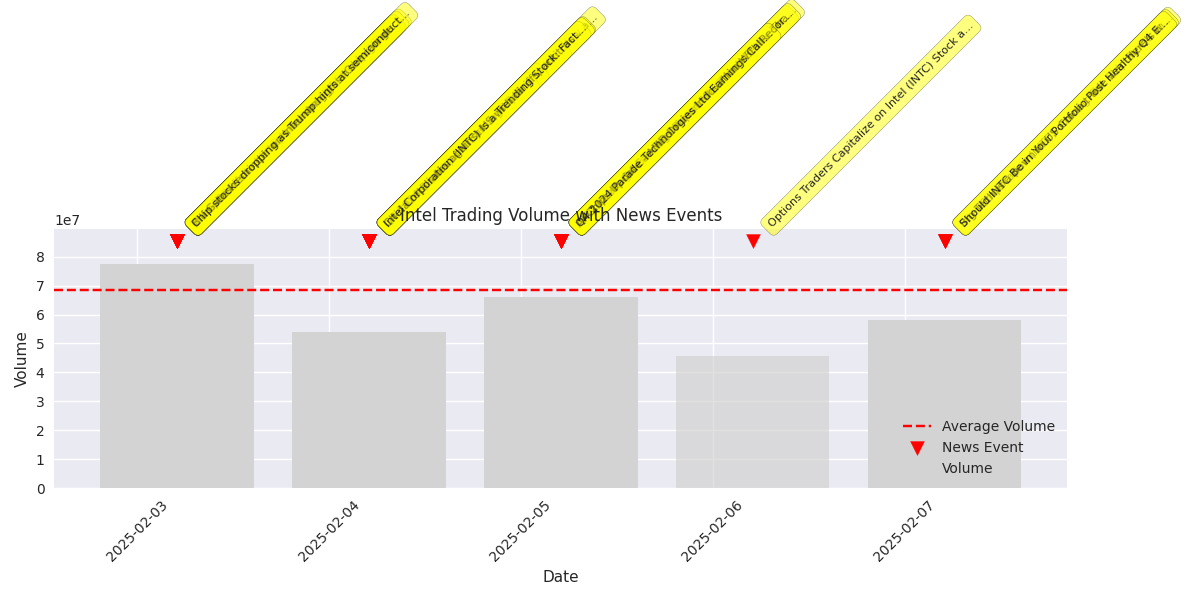
Recent News Impact on Intel's Trading Activity
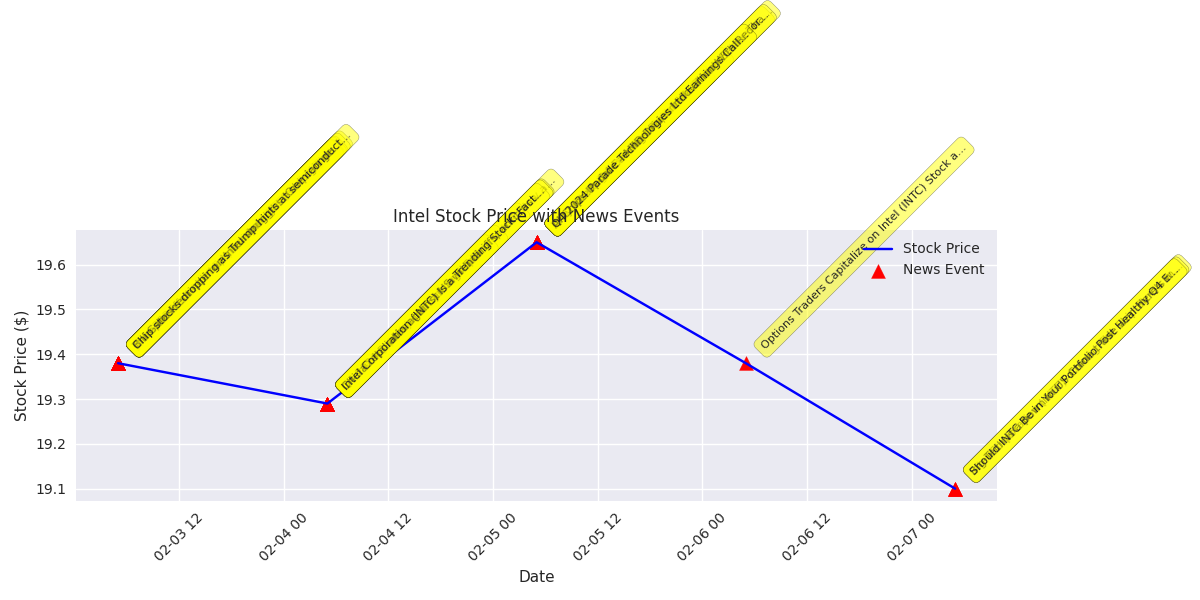
![Stock price movements with overlaid news events showing the relationship between significant news and price action. Stock price movements with overlaid news events showing the relationship between significant news and price action.](/assets/analysis/2efd225d-40a0-4525-bc8a-34473bbc797c//919af72b-f140-4eaf-b067-66f912e776dd.png)
Intel Stock Price Direction Prediction Model Shows Balanced Performance
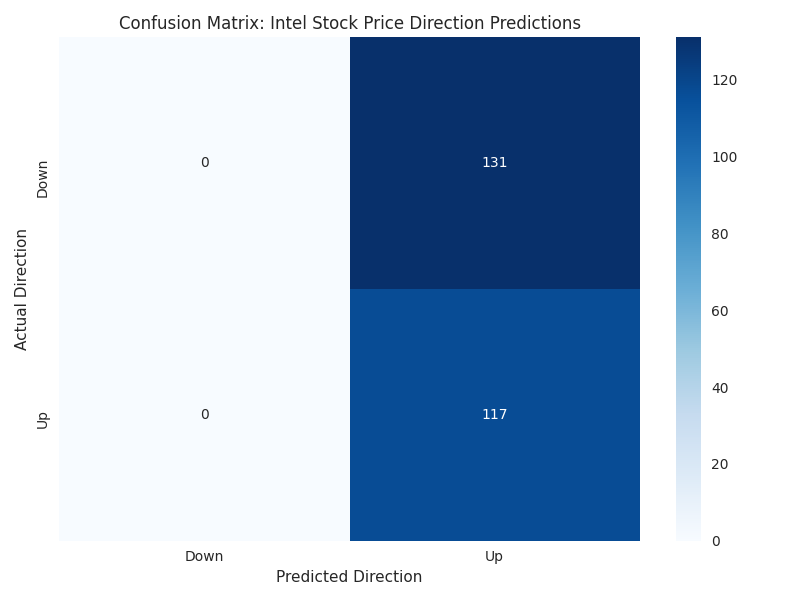
![Confusion matrix showing the model's prediction accuracy for Intel stock price movements, with actual vs predicted up/down directions. Confusion matrix showing the model's prediction accuracy for Intel stock price movements, with actual vs predicted up/down directions.](/assets/analysis/2efd225d-40a0-4525-bc8a-34473bbc797c//3a24349e-b515-49fa-b16a-5f0fc3227e95.png)
Intel Stock Shows Strong 5-Day Price Direction Prediction Accuracy with Balanced Risk Profile
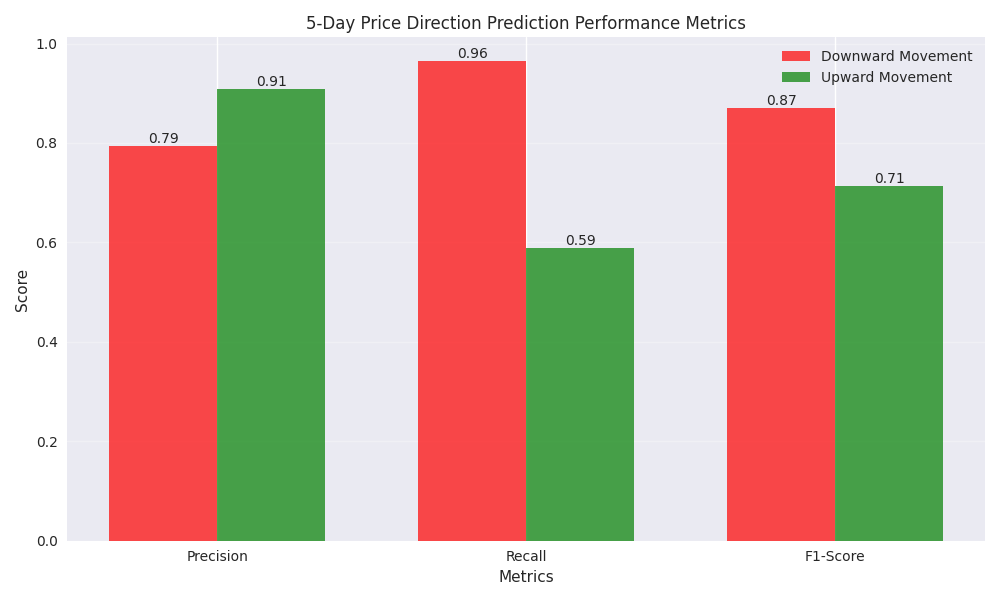
![Bar plot comparing precision, recall, and F1-scores for upward and downward price movements in Intel stock's 5-day prediction model. Bar plot comparing precision, recall, and F1-scores for upward and downward price movements in Intel stock's 5-day prediction model.](/assets/analysis/2efd225d-40a0-4525-bc8a-34473bbc797c//14414913-cb3c-41a5-9e2f-a56e0ad77f2d.png)
Long-Term Analysis Shows Strong Bearish Trend with High Prediction Confidence
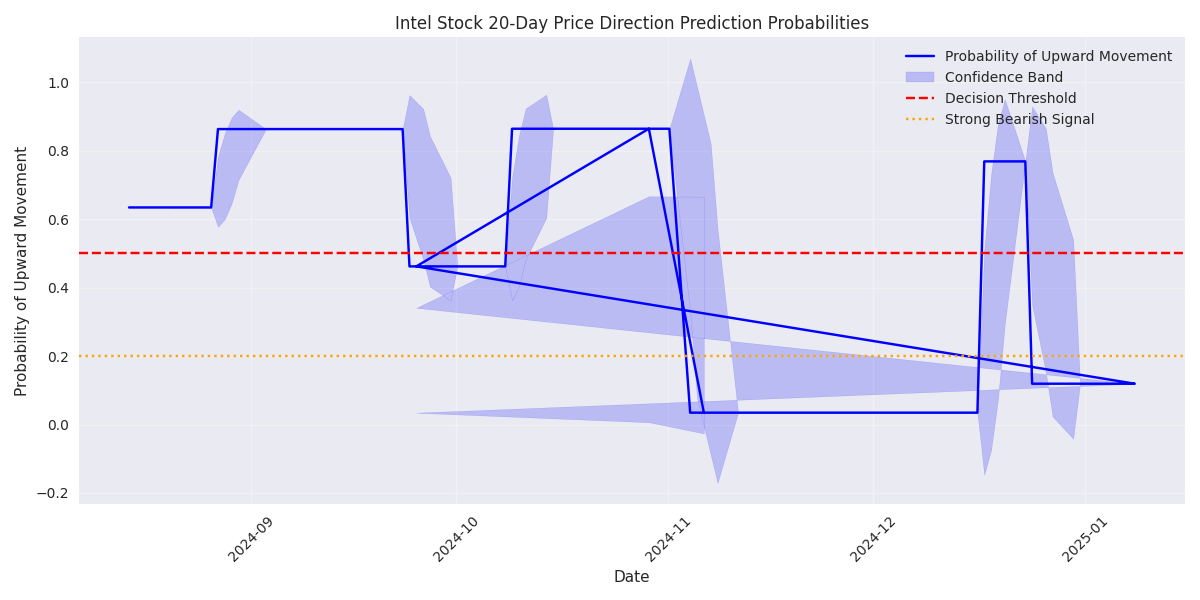
![Line plot showing Intel stock's 20-day prediction probabilities over time with confidence band, highlighting the strong bearish signal below 0.2 probability threshold. Line plot showing Intel stock's 20-day prediction probabilities over time with confidence band, highlighting the strong bearish signal below 0.2 probability threshold.](/assets/analysis/2efd225d-40a0-4525-bc8a-34473bbc797c//659eaa58-363e-422b-a40e-be3095e41109.png)