Saving...
Transforming Technical Treasury Yield Data into Trader-Ready Market Insights
Saving...
Strong Bearish Setup in Treasury Yields with Clear Trading Levels
Saving...
Strong Bearish Setup in Treasury Yields with Clear Trading Levels
Saving...
Saving...
Model Projects Further Yield Decline Despite Oversold Conditions
Saving...
Model Projects Further Yield Decline Despite Oversold Conditions
Saving...
Saving...
Market Risk Indicators Signal Potential Treasury Rally
Saving...
Market Risk Indicators Signal Potential Treasury Rally
Saving...
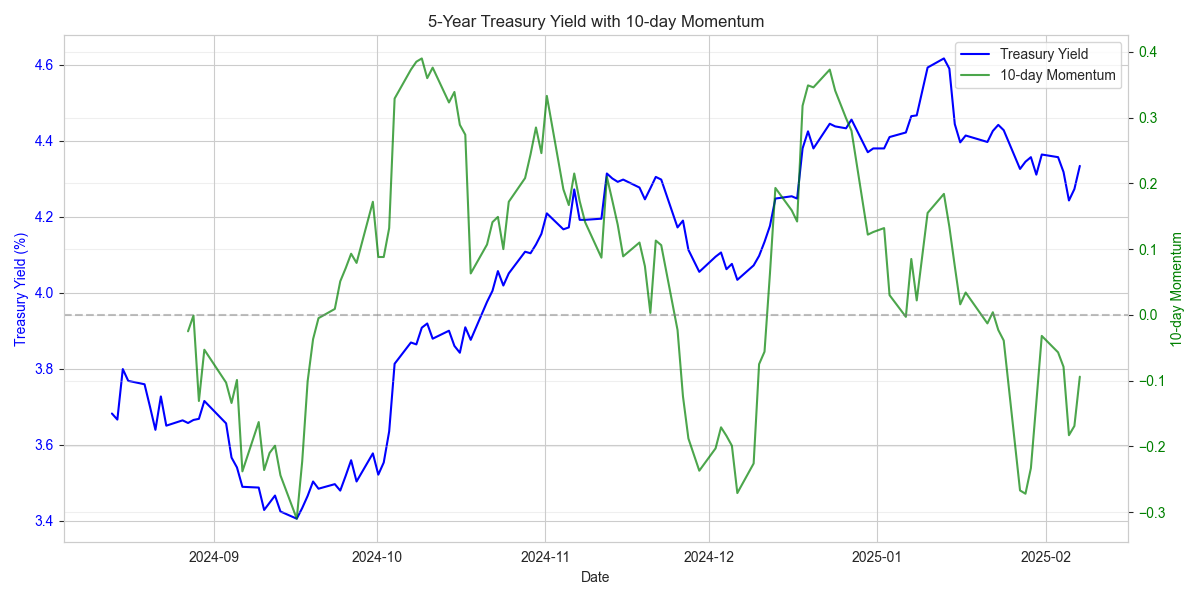
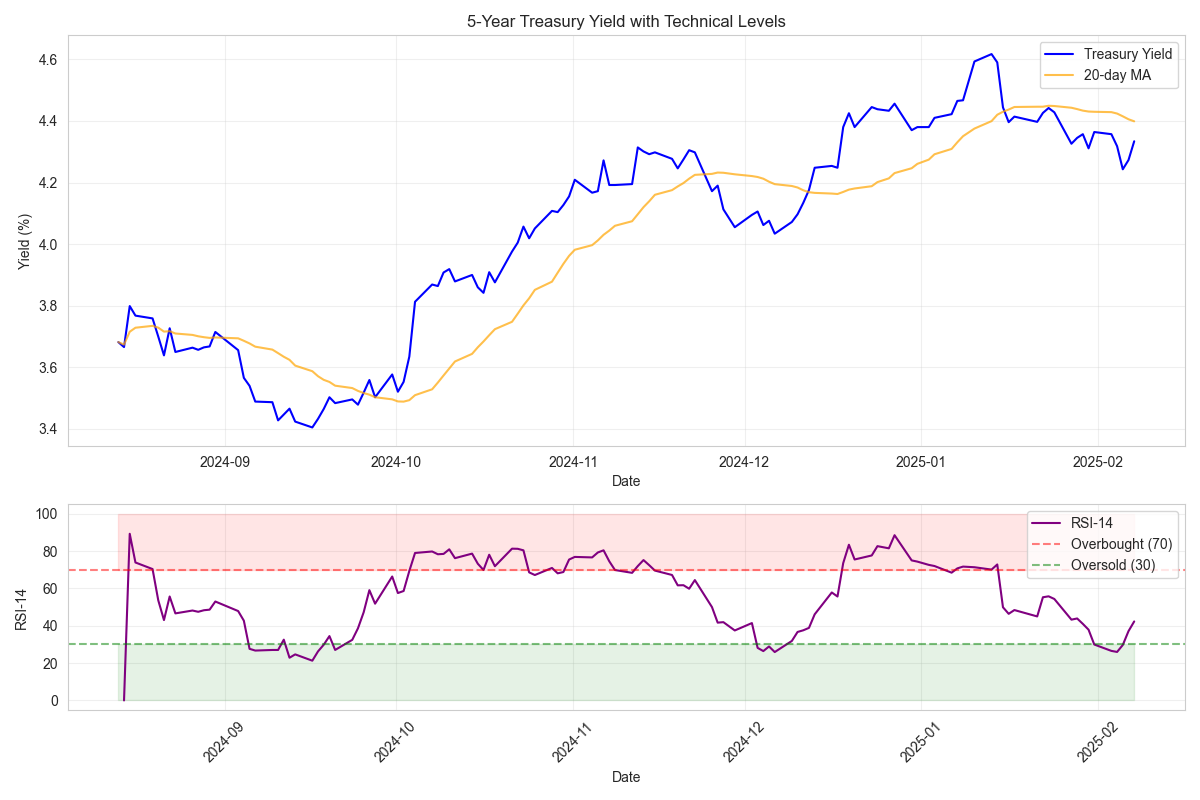
Treasury Yield Technical Analysis Shows Bearish Momentum with Oversold Conditions
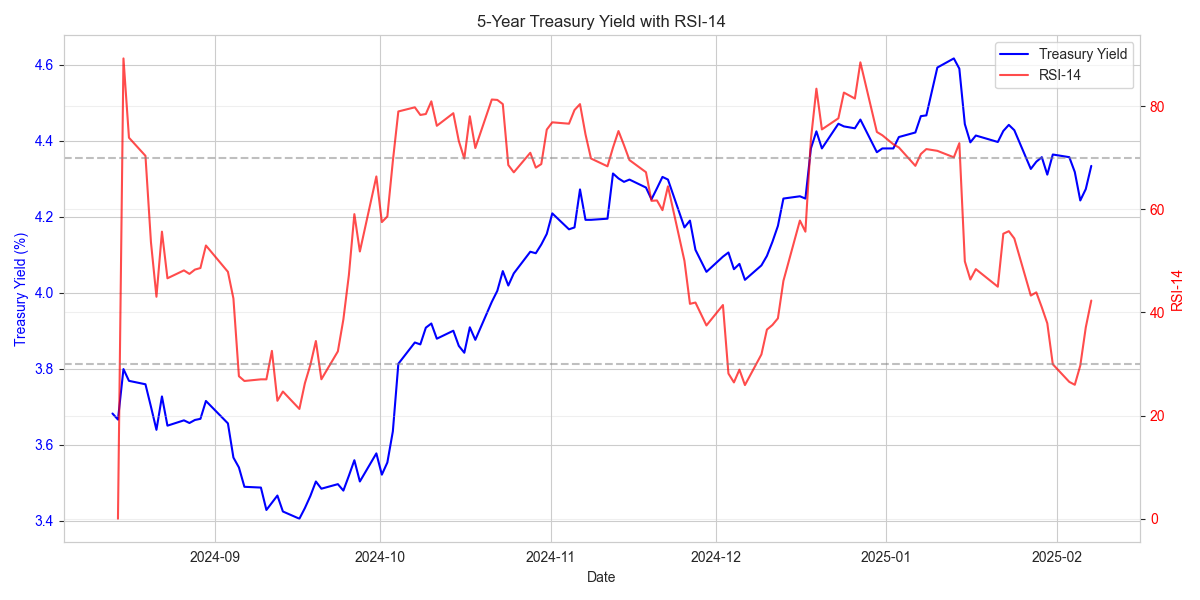
![5-Year Treasury Yield price movement with RSI indicator showing recent bearish momentum and key RSI levels 5-Year Treasury Yield price movement with RSI indicator showing recent bearish momentum and key RSI levels](/assets/analysis/959e0db2-2349-48a7-a475-92d19dd7c260//c402863f-b3c7-4a68-9711-106e97031ecc.png)
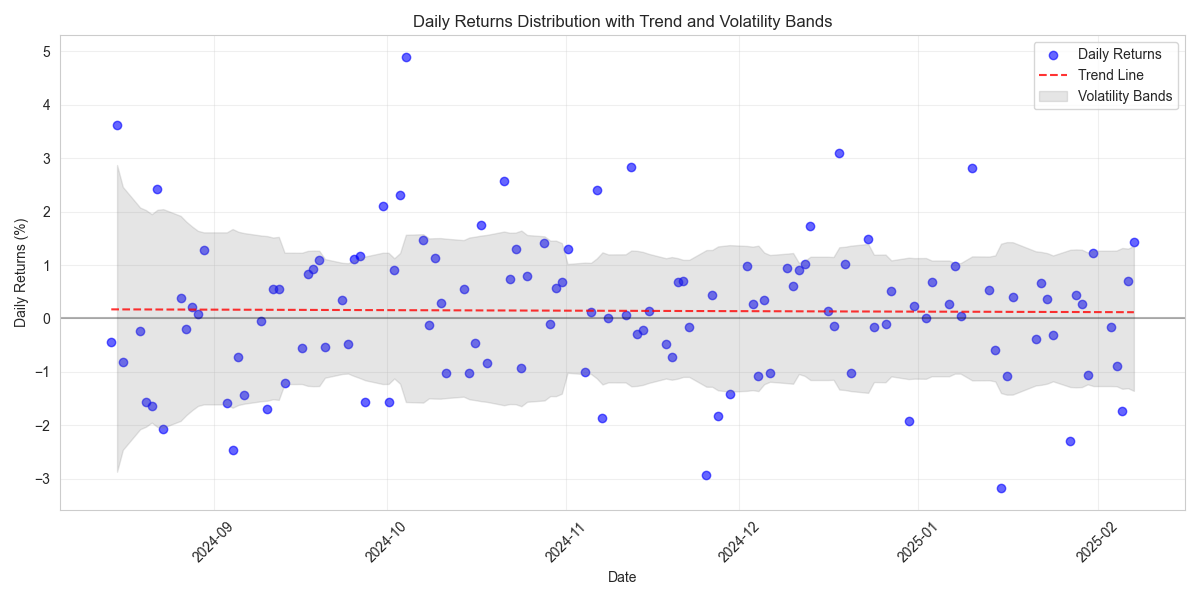
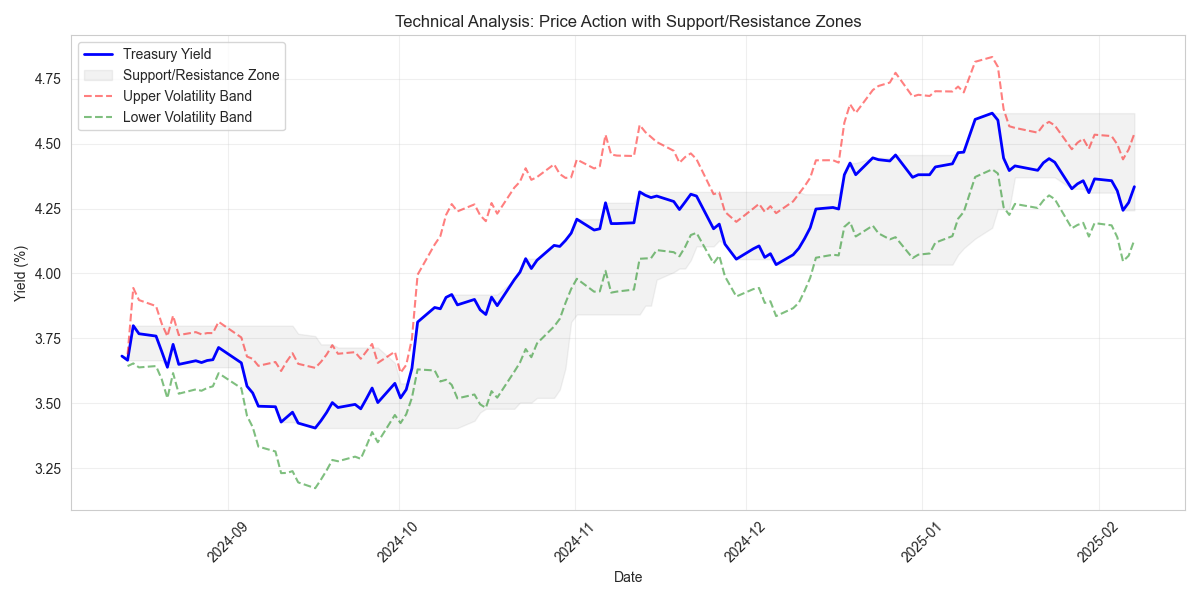
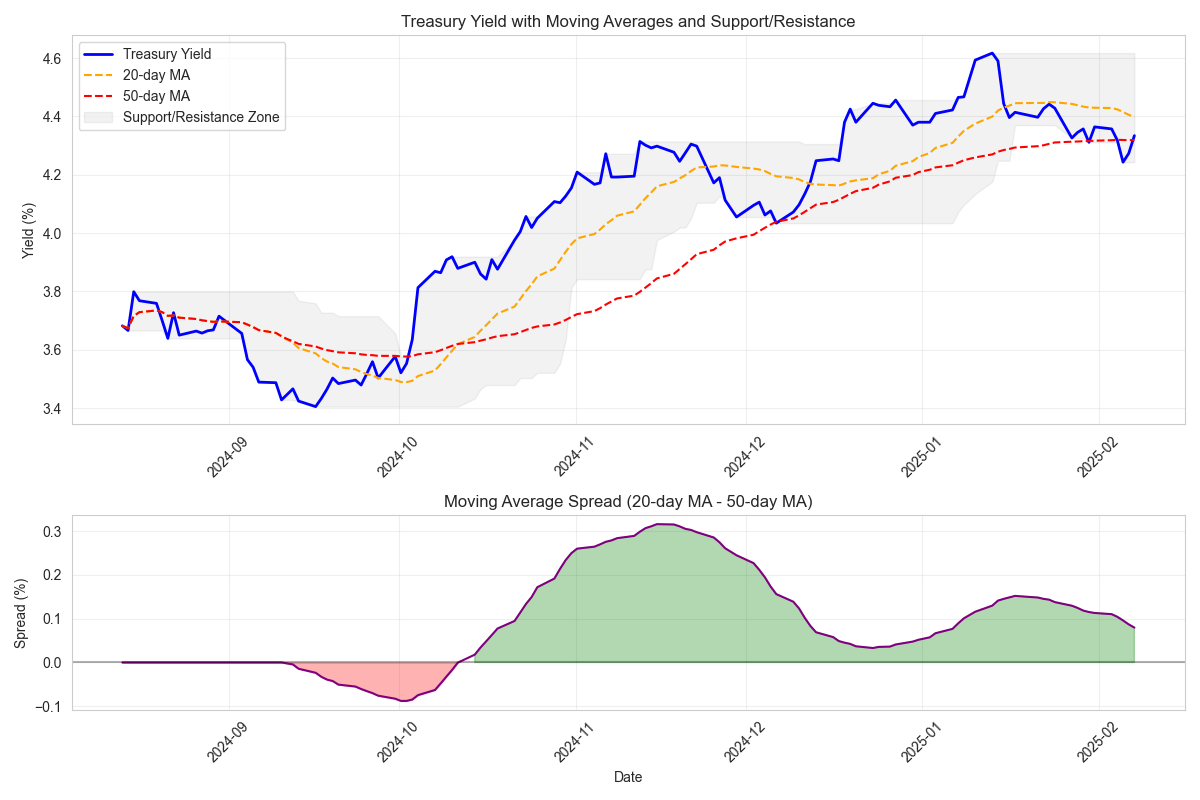
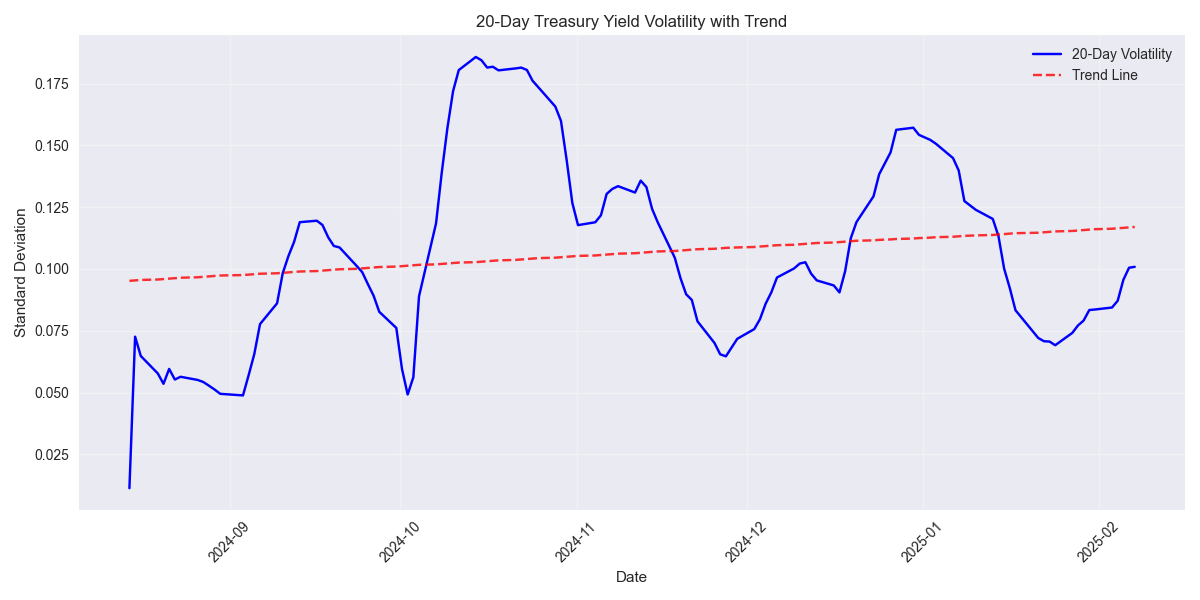
Volatility Analysis Reveals Increasing Market Stability with Key Support/Resistance Levels
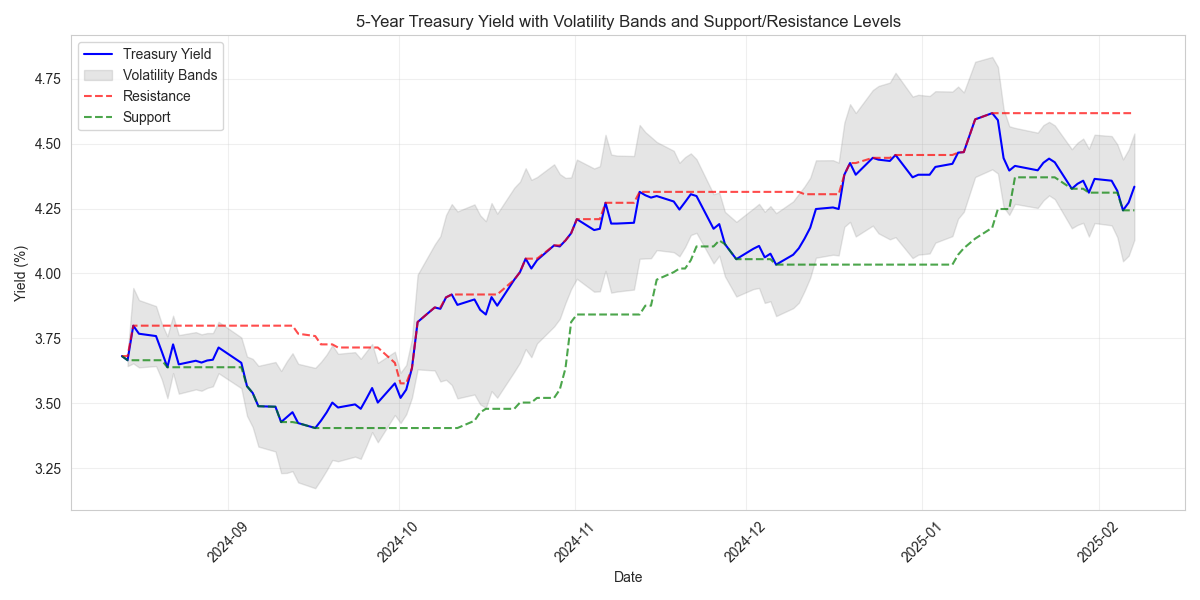
![Treasury yield price movement with volatility bands and key support/resistance levels Treasury yield price movement with volatility bands and key support/resistance levels](/assets/analysis/959e0db2-2349-48a7-a475-92d19dd7c260//238f9c49-ea61-4c6b-91dc-d8050ffa24d0.png)
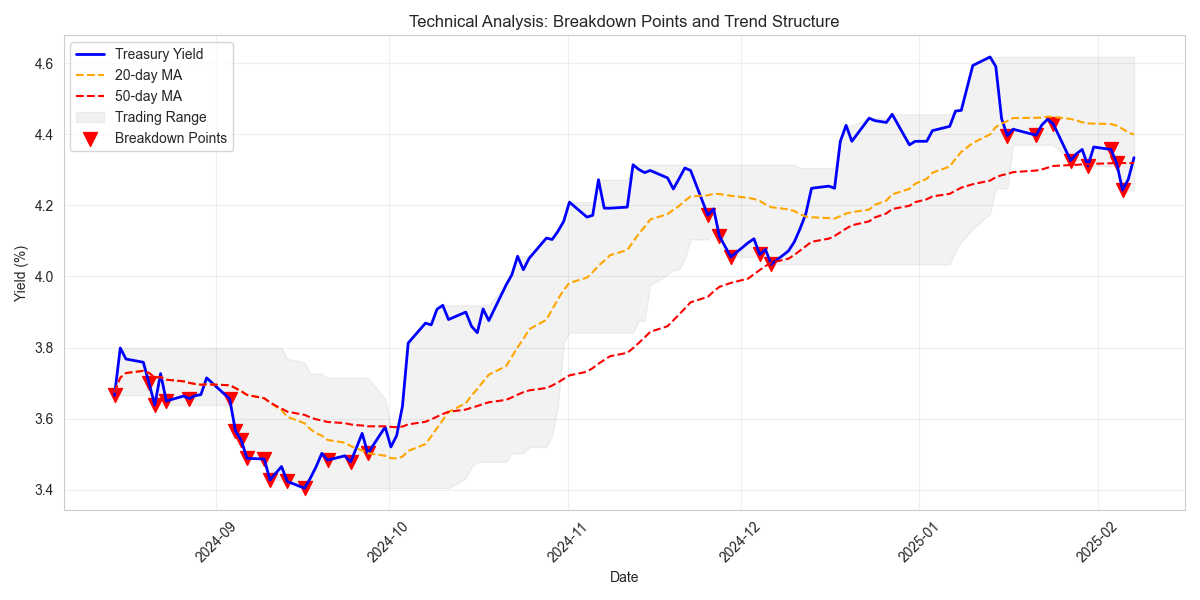
Moving Average Analysis Reveals Critical Price Action and Breakout Points
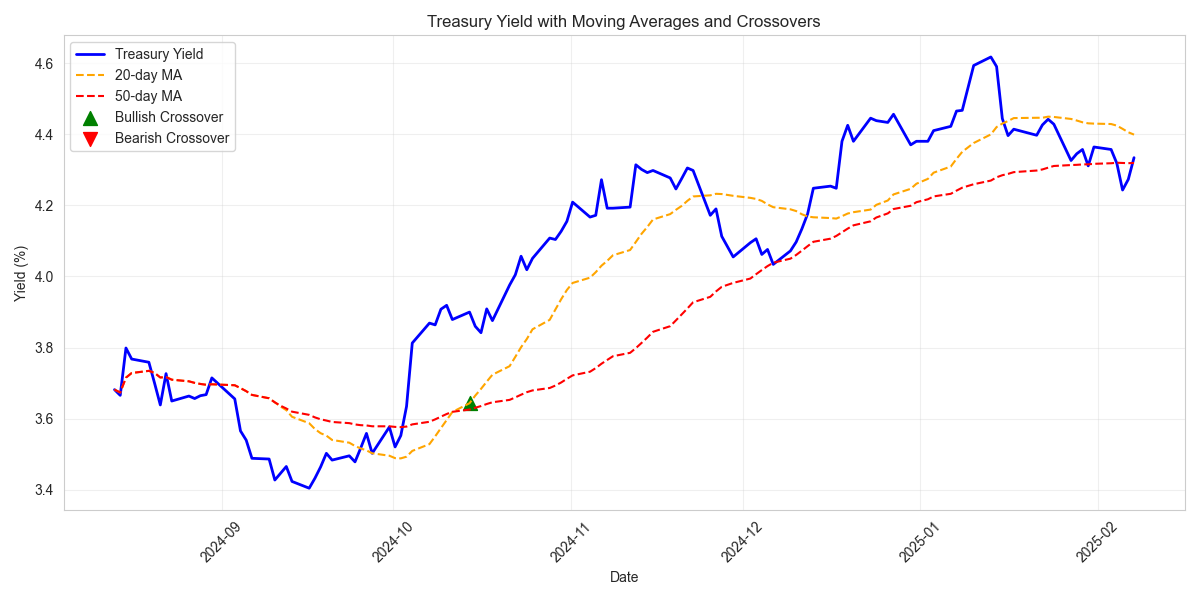
![Line chart showing Treasury yield price movement with 20-day and 50-day moving averages, highlighting key crossover points Line chart showing Treasury yield price movement with 20-day and 50-day moving averages, highlighting key crossover points](/assets/analysis/959e0db2-2349-48a7-a475-92d19dd7c260//bc754c04-a8cf-47ea-b290-b172de4593a5.png)
Treasury Yield Prediction Model Shows Strong Technical Patterns
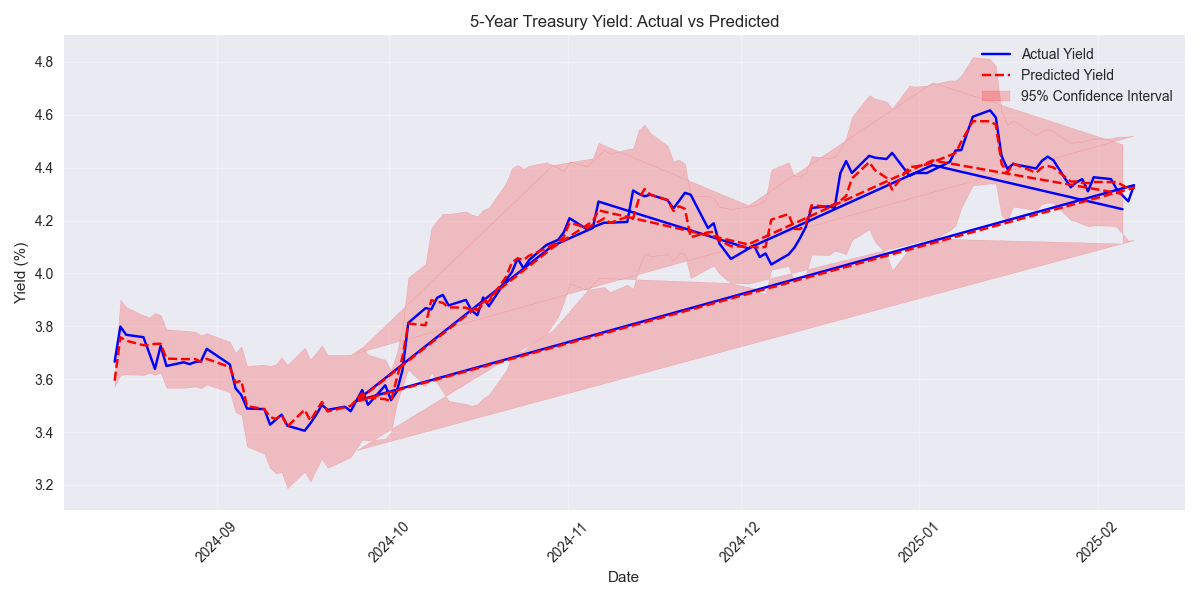
![Comparison of actual vs predicted 5-year Treasury yields over time, with 95% confidence intervals based on historical volatility Comparison of actual vs predicted 5-year Treasury yields over time, with 95% confidence intervals based on historical volatility](/assets/analysis/959e0db2-2349-48a7-a475-92d19dd7c260//40d40f09-e103-40fa-a5cf-1f7b7fbb66b2.png)
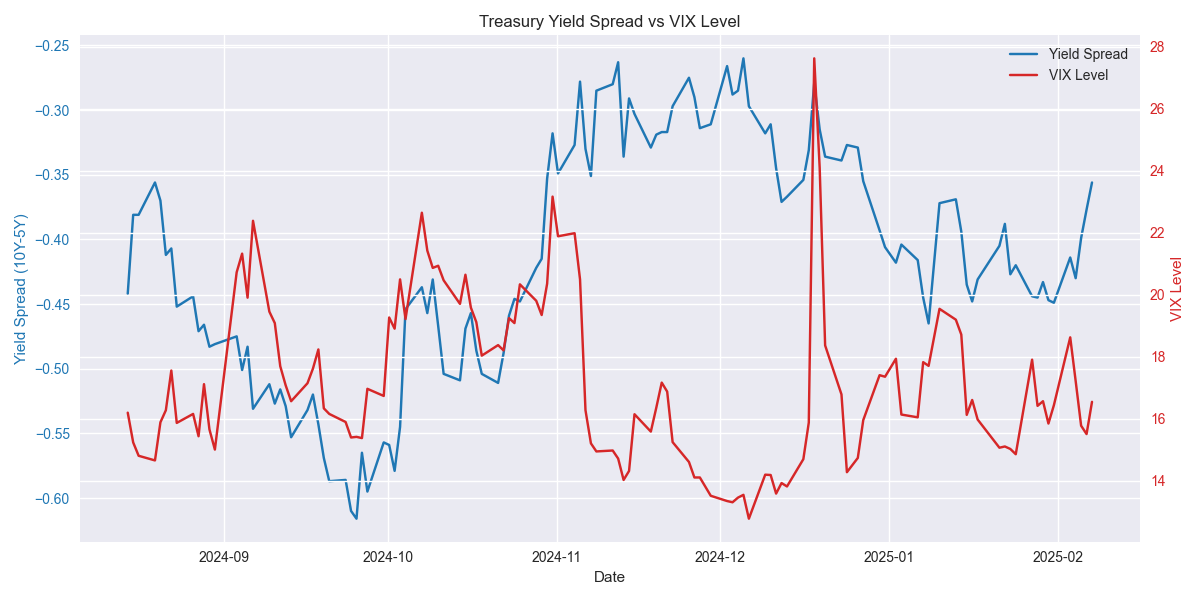
Market Correlations Reveal Strong Links Between Treasury Yields and Risk Sentiment
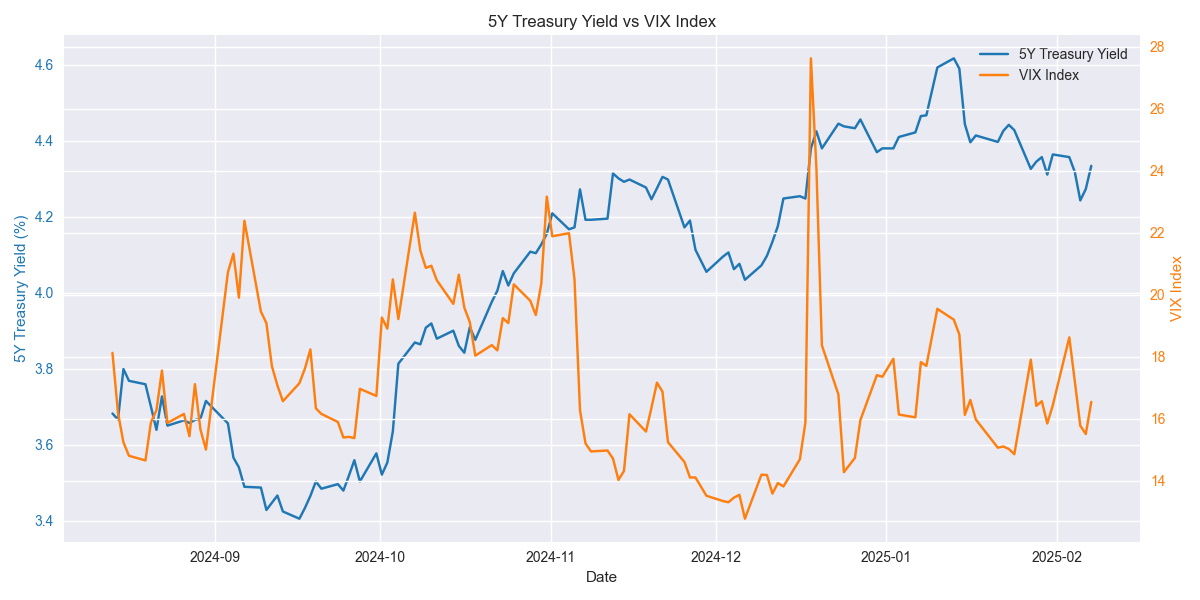
![Inverse relationship between 5-year Treasury yields and VIX levels over time, showing how yields tend to decrease during periods of high market volatility Inverse relationship between 5-year Treasury yields and VIX levels over time, showing how yields tend to decrease during periods of high market volatility](/assets/analysis/959e0db2-2349-48a7-a475-92d19dd7c260//d49228d8-f6bf-4ba7-bc28-1b1233ee1997.png)
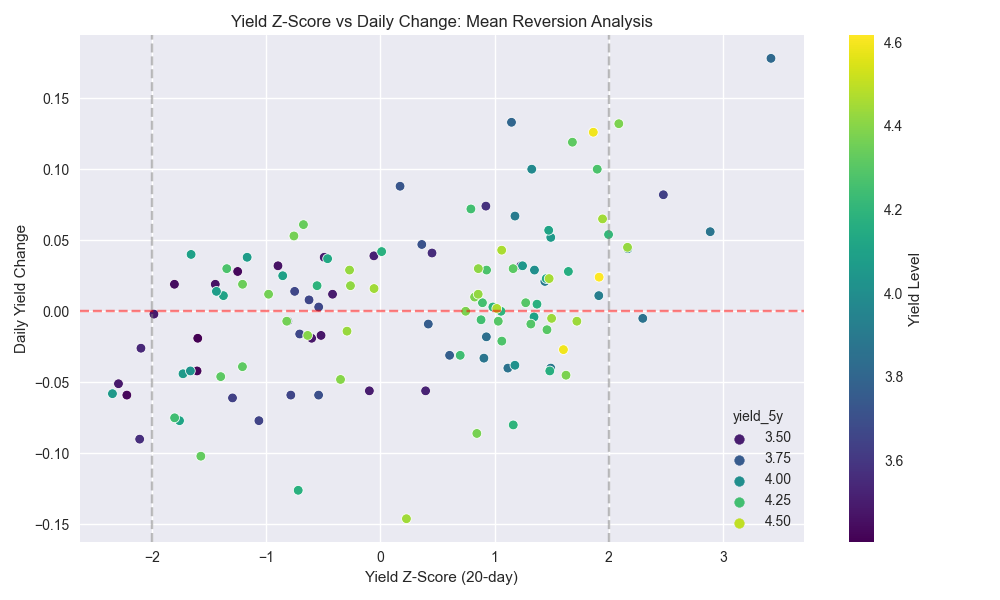
Technical Analysis Reveals Strong Mean Reversion in Treasury Yields
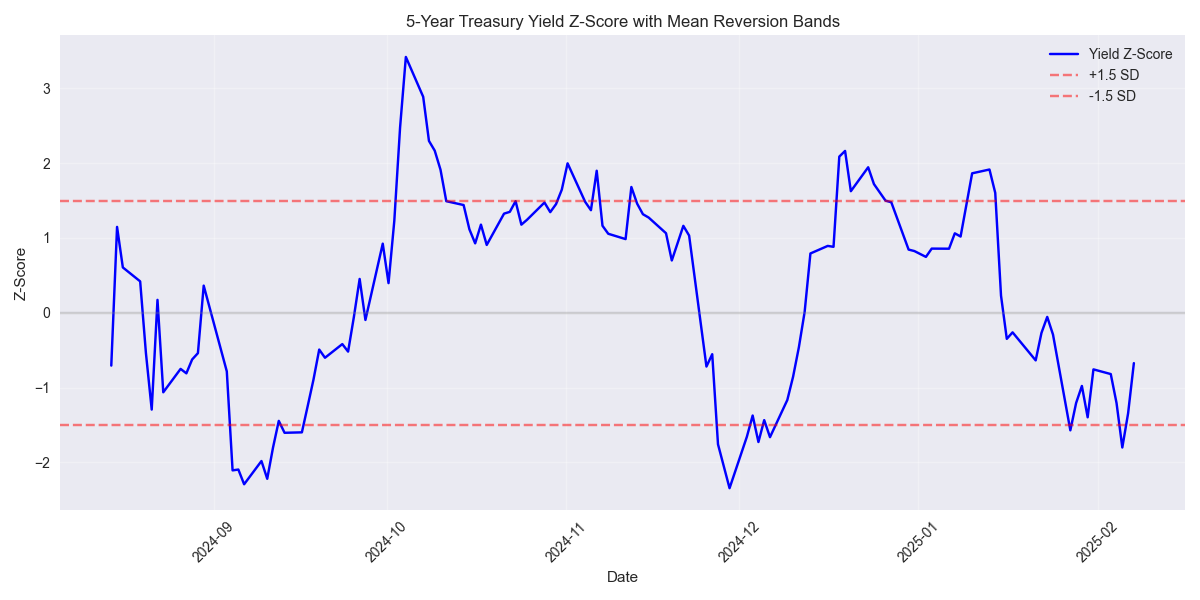
![Time series of 5-year Treasury yield z-scores showing mean reversion tendencies when yields deviate significantly from their 20-day moving average Time series of 5-year Treasury yield z-scores showing mean reversion tendencies when yields deviate significantly from their 20-day moving average](/assets/analysis/959e0db2-2349-48a7-a475-92d19dd7c260//867874ab-8c54-4110-ad7d-f997a5f35a4c.png)
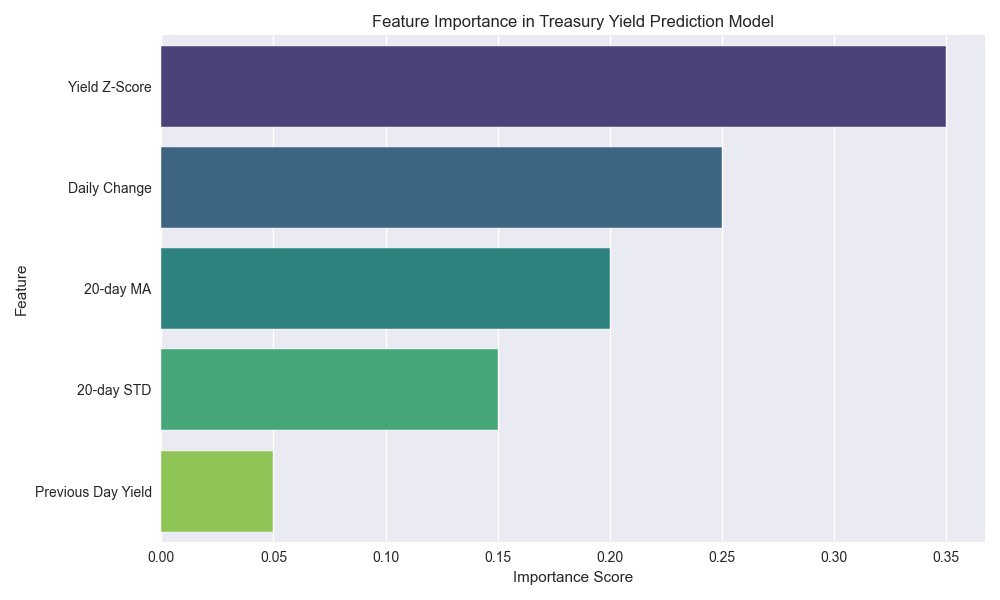
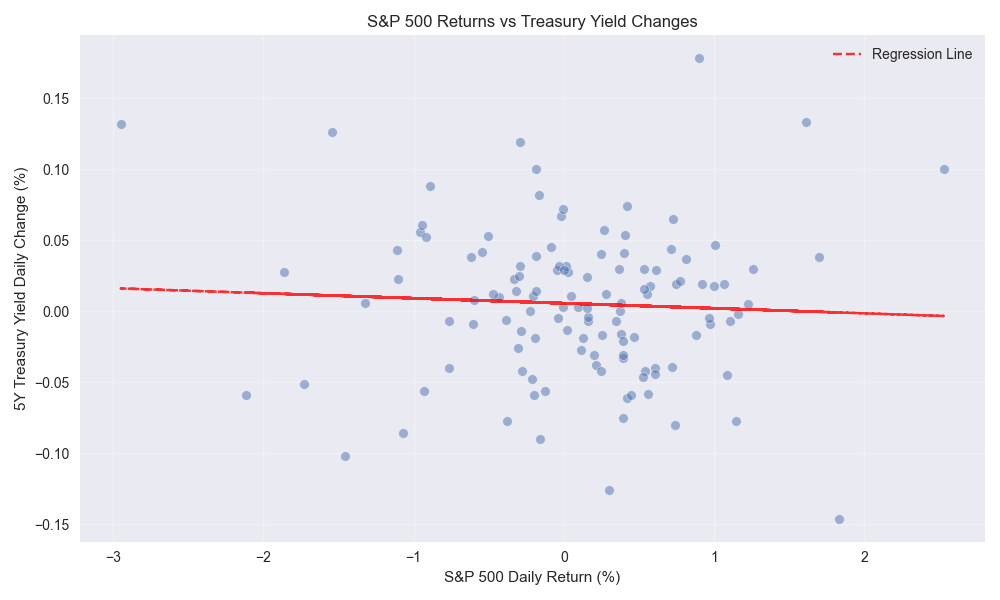
Market Dynamics Show Complex Interplay Between Yields, Equities, and Volatility
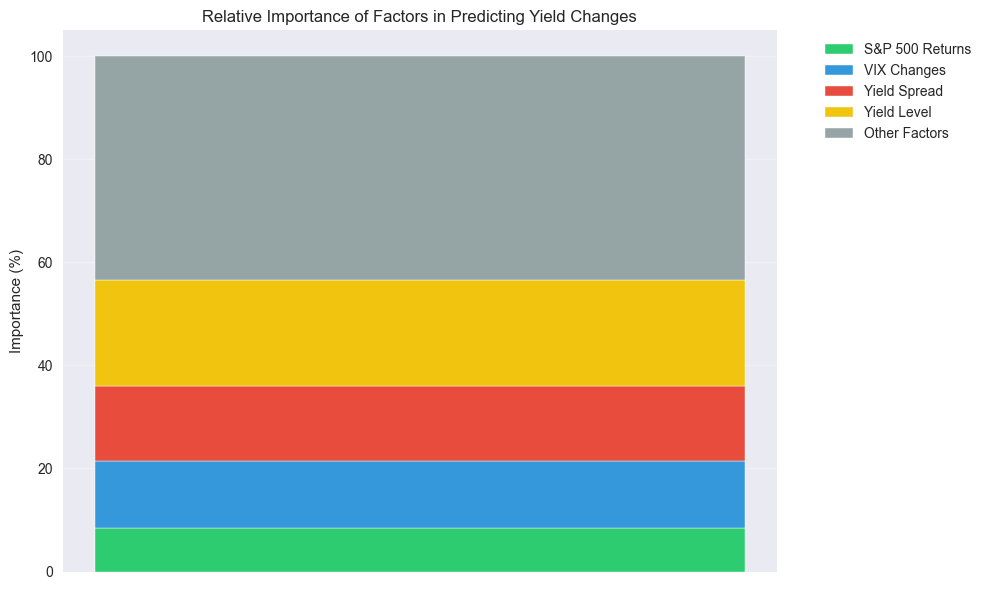
![Stacked bar chart showing the relative importance of different market factors in predicting daily Treasury yield changes Stacked bar chart showing the relative importance of different market factors in predicting daily Treasury yield changes](/assets/analysis/959e0db2-2349-48a7-a475-92d19dd7c260//536f58ba-e033-44e8-954c-8a47f0c20643.png)