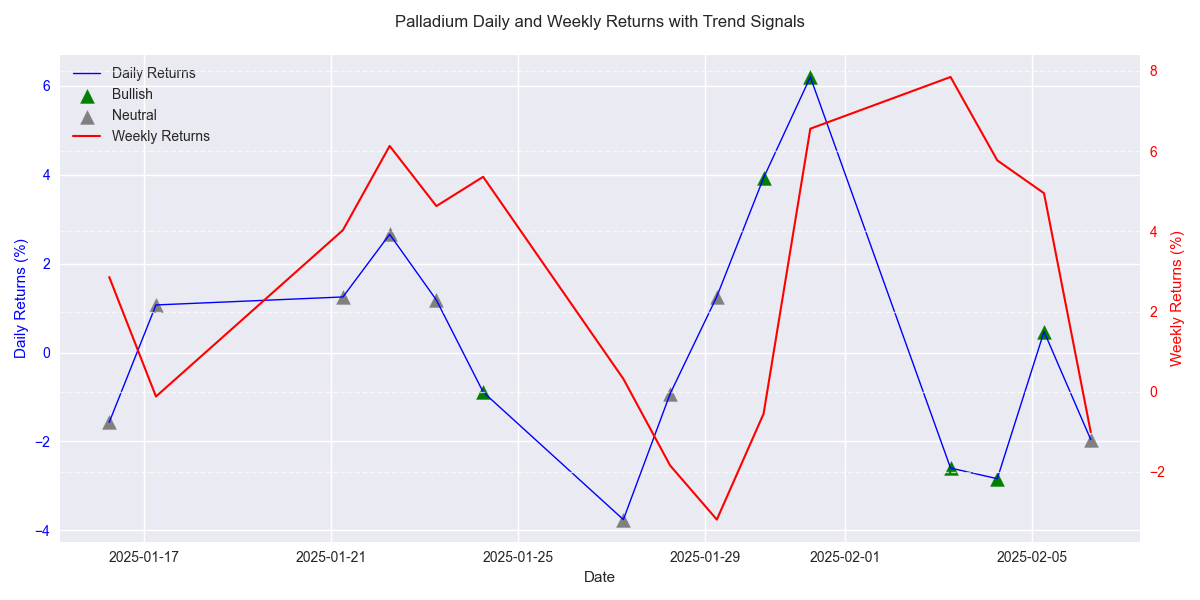
Saving...
Palladium Traders' Quick Guide: Navigating Volatile Markets with Precision
Saving...
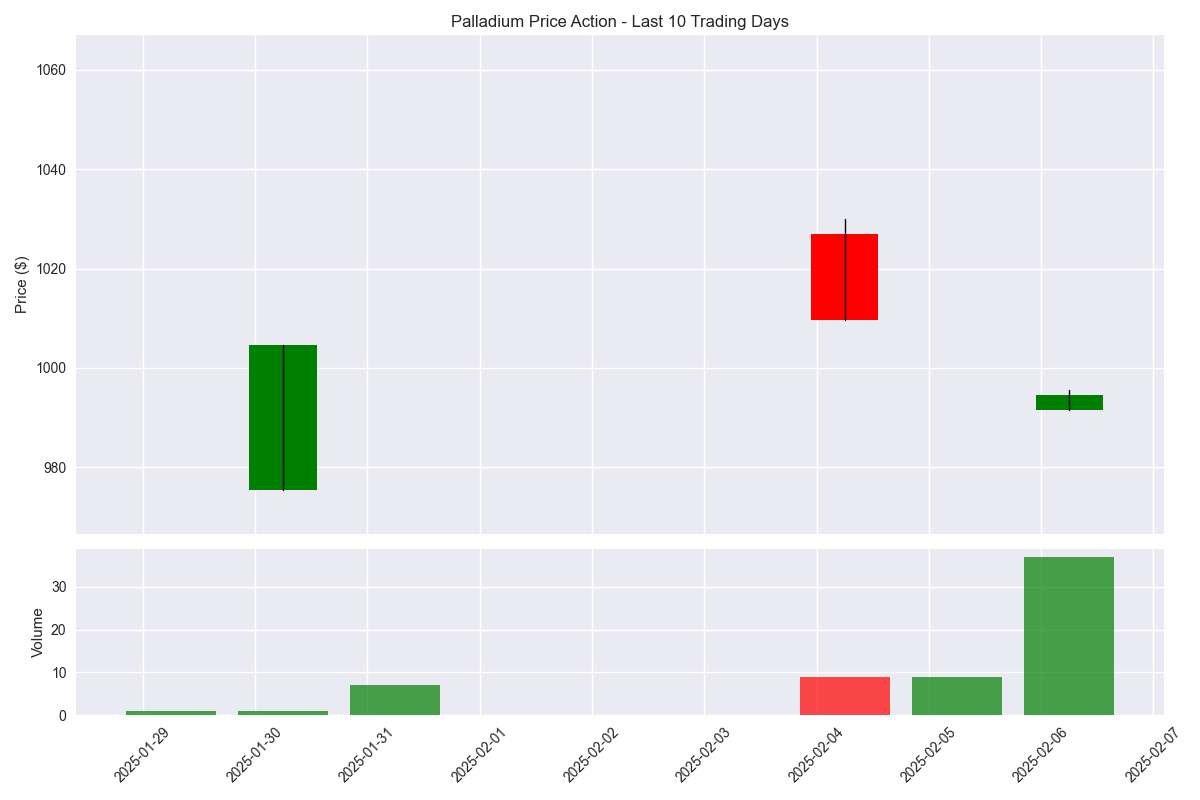
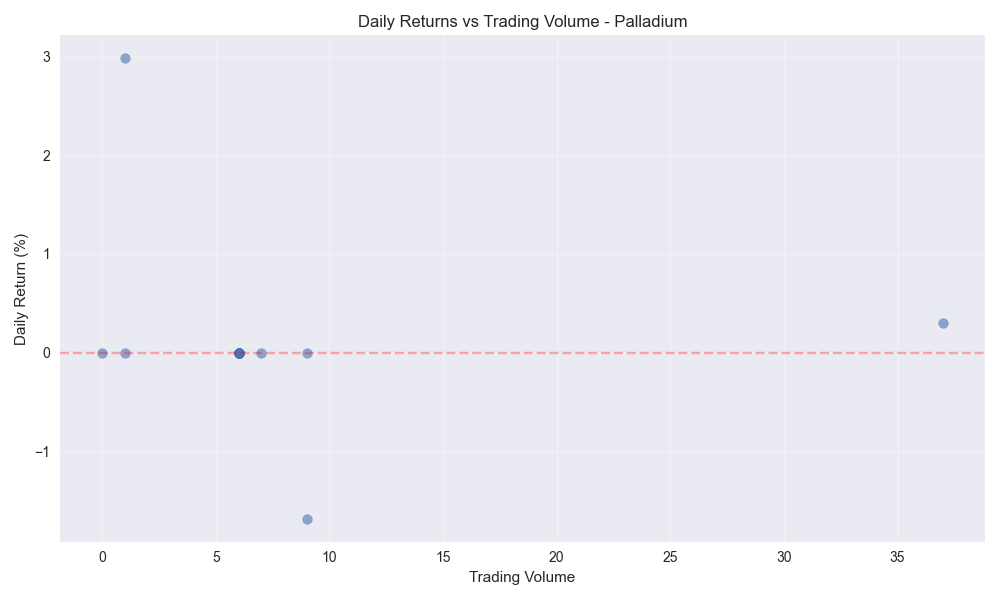
Palladium Shows Mixed Signals with Technical Breakout but Volume Concerns
Saving...
Palladium Shows Mixed Signals with Technical Breakout but Volume Concerns
Saving...
Saving...
Clear Trading Range Offers Actionable Opportunities
Saving...
Clear Trading Range Offers Actionable Opportunities
Saving...
Saving...
Short-term Price Stabilization Expected with Downside Protection
Saving...
Short-term Price Stabilization Expected with Downside Protection
Saving...
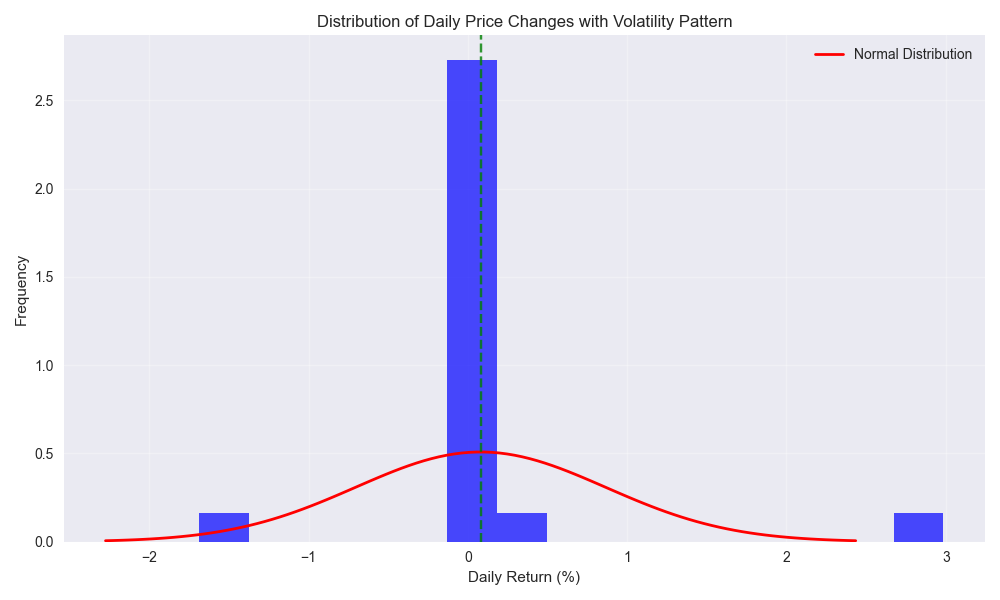
Recent Palladium Price Analysis Shows Volatility and Mixed Trading Pattern
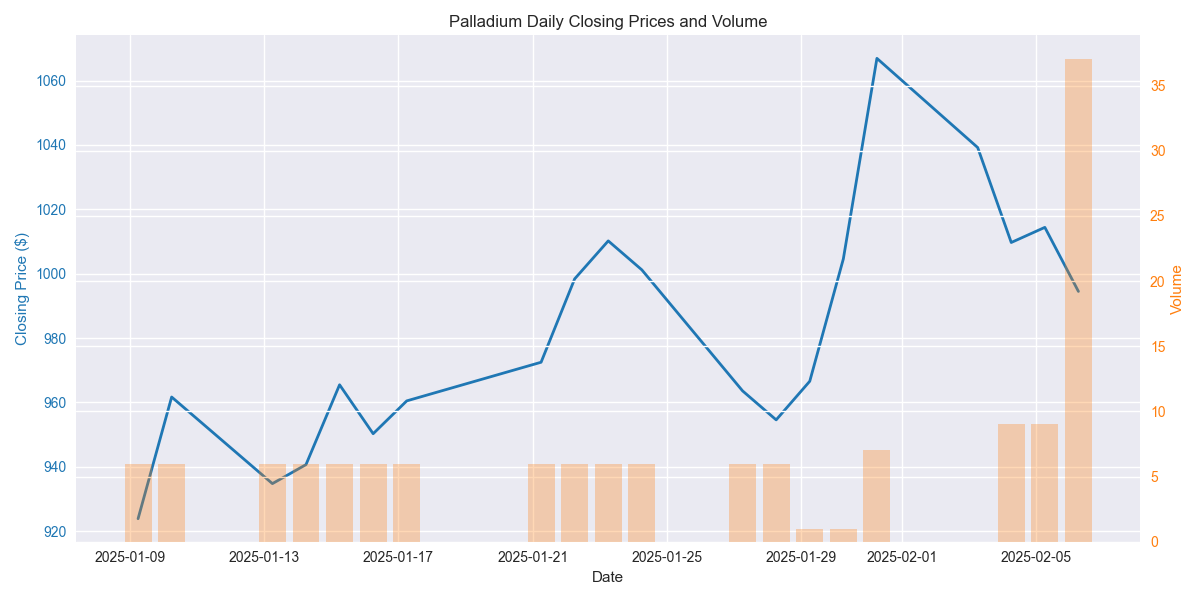
![Daily closing prices of Palladium with trading volume over the past 30 days showing price trends and volume patterns. Daily closing prices of Palladium with trading volume over the past 30 days showing price trends and volume patterns.](/assets/analysis/796d5467-cf91-4146-989d-62b6b8d59a02//808b4a9d-62ed-43a6-bfd0-5327cb5287f8.png)
Key Support and Resistance Levels Identified with Strong Technical Patterns
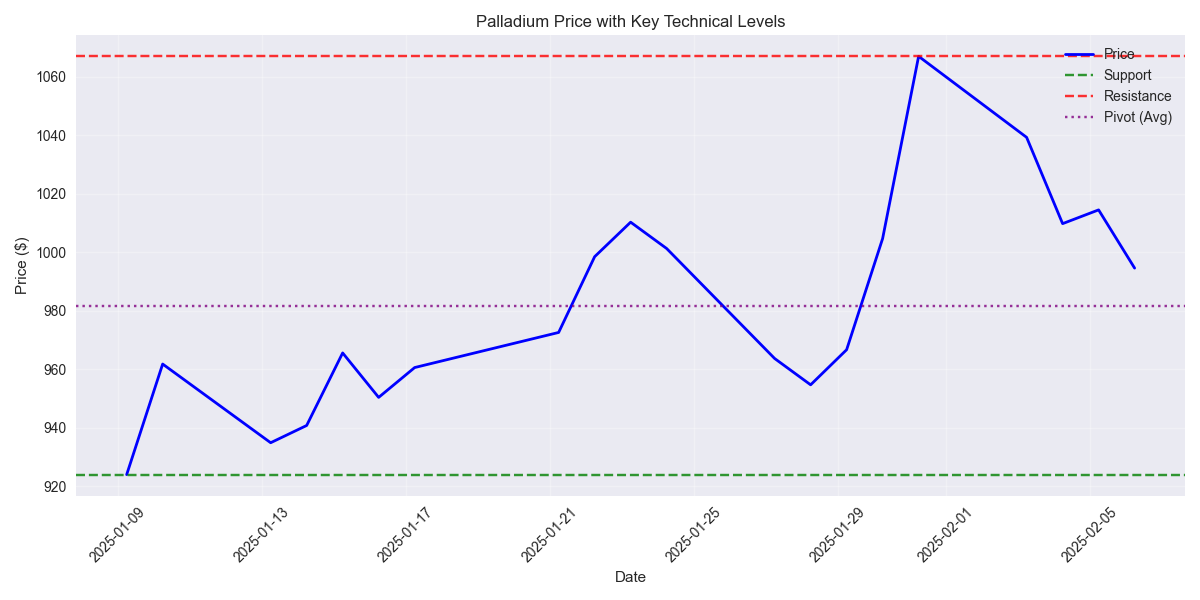
![Palladium price chart showing key support, resistance, and pivot levels over the past 30 days. Palladium price chart showing key support, resistance, and pivot levels over the past 30 days.](/assets/analysis/796d5467-cf91-4146-989d-62b6b8d59a02//1291ca43-1749-4905-8e33-55025c21c611.png)
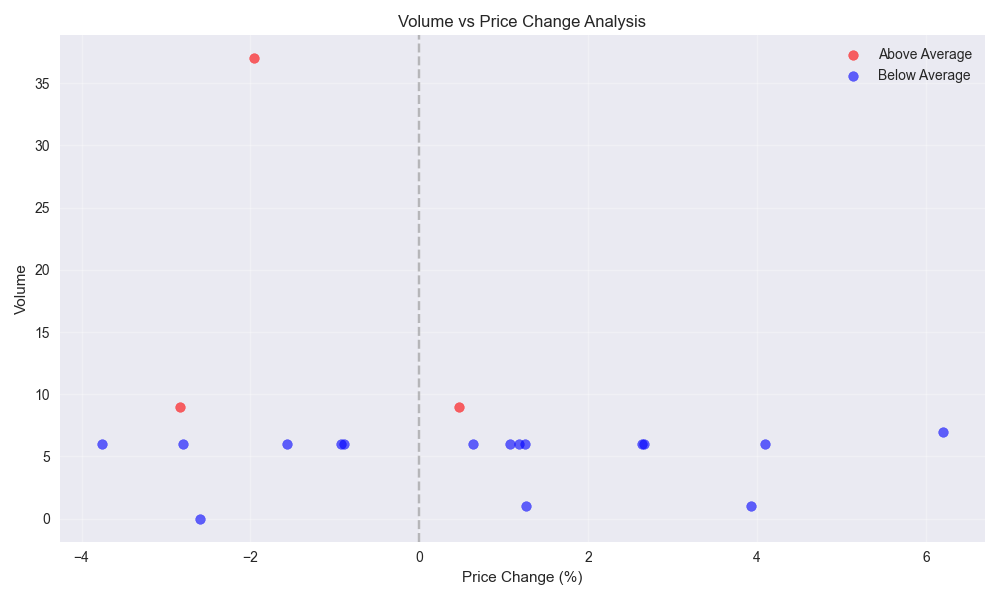
Volume Analysis Reveals Key Trading Signals and Market Momentum
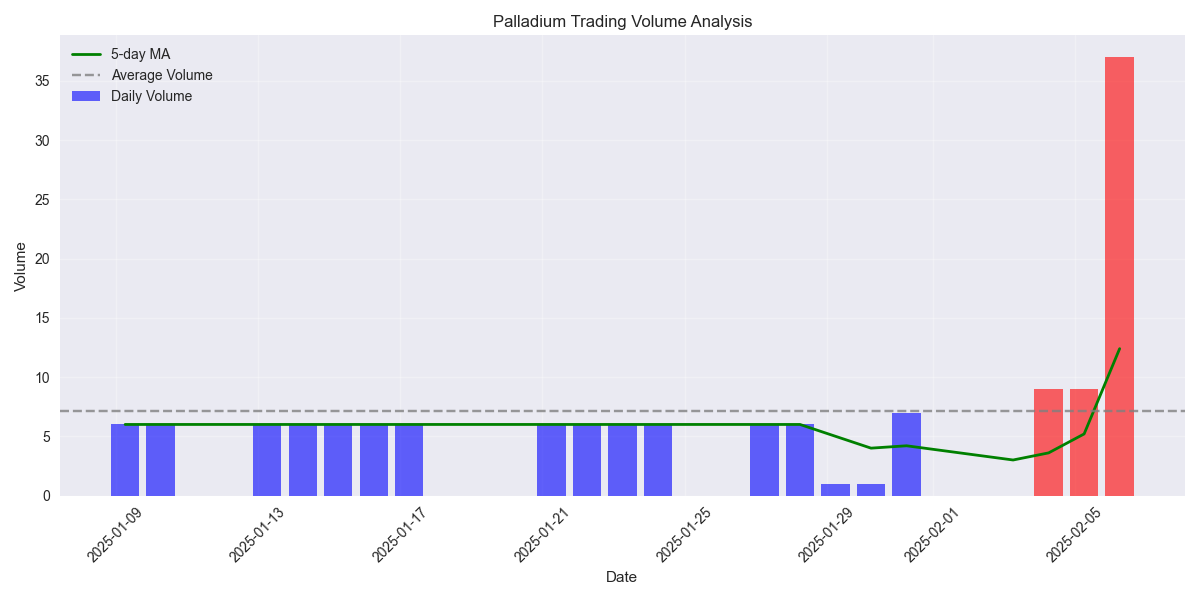
![Daily trading volume with 5-day moving average, highlighting above-average (red) and below-average (blue) volume days. Daily trading volume with 5-day moving average, highlighting above-average (red) and below-average (blue) volume days.](/assets/analysis/796d5467-cf91-4146-989d-62b6b8d59a02//ad06e63e-02a0-40ce-984a-b959858a0d42.png)
Technical Analysis Shows Emerging Bullish Momentum Despite Recent Volatility
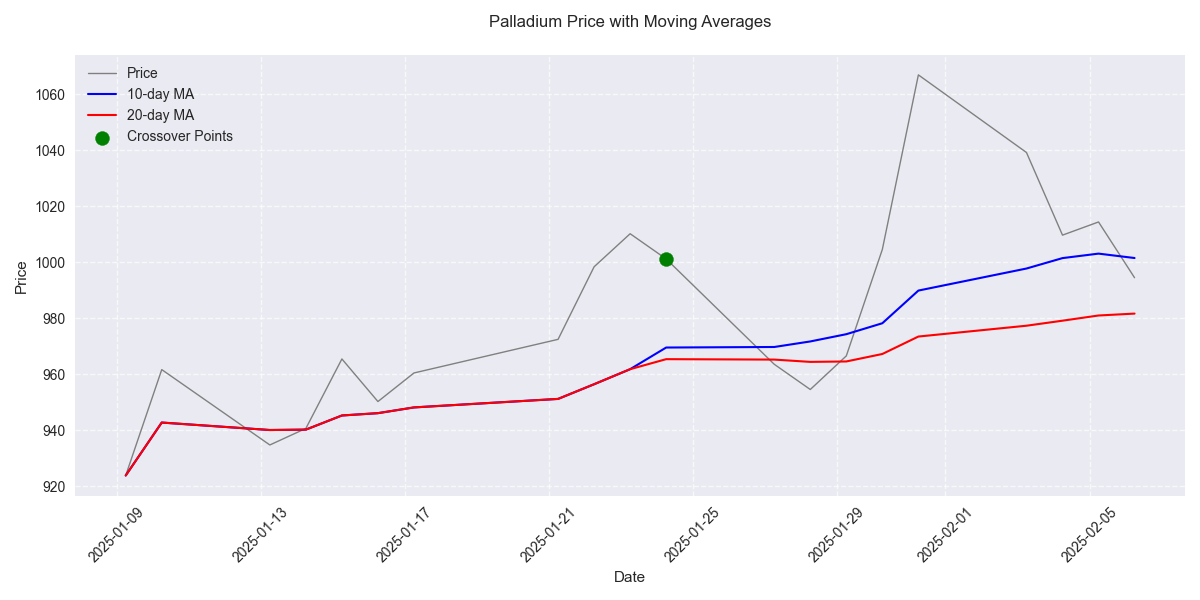
![Palladium price action with 10-day and 20-day moving averages showing bullish crossover signals Palladium price action with 10-day and 20-day moving averages showing bullish crossover signals](/assets/analysis/796d5467-cf91-4146-989d-62b6b8d59a02//416ee774-5d8d-4197-a492-55b519611389.png)
Initial Palladium Price Prediction Model Shows Strong Short-term Forecasting Potential
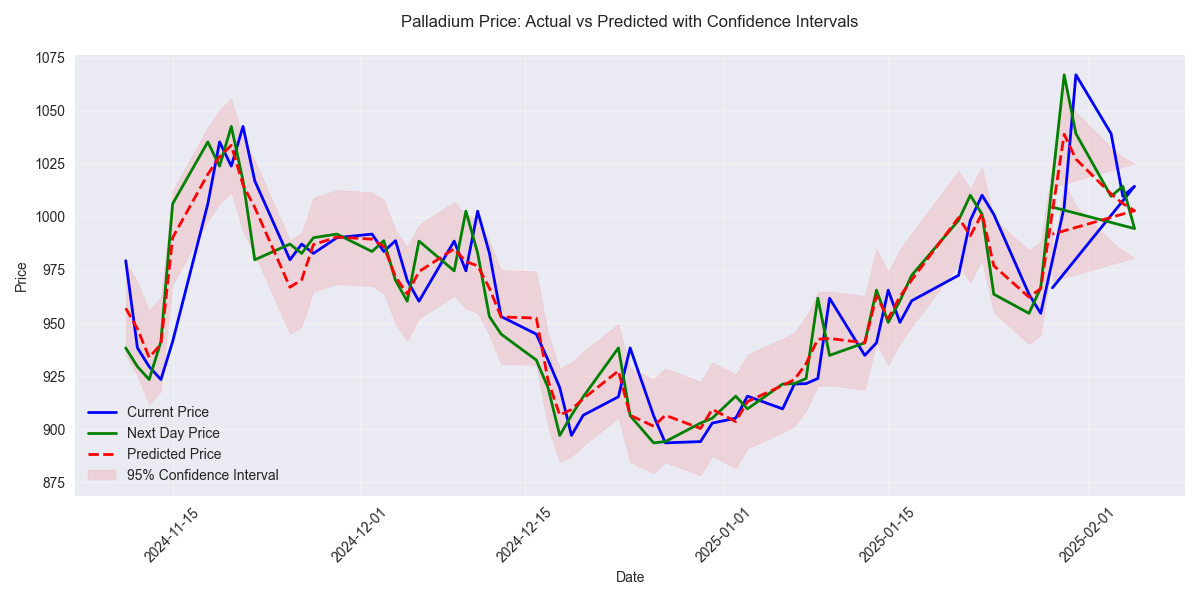
![Comparison of actual vs predicted Palladium prices over time, showing the model's predictions with 95% confidence intervals. Comparison of actual vs predicted Palladium prices over time, showing the model's predictions with 95% confidence intervals.](/assets/analysis/796d5467-cf91-4146-989d-62b6b8d59a02//b99afa24-c1ec-4b4d-b5f1-00eadee53a86.png)
Weekly Price Predictions Show Potential Market Stabilization
![Line chart showing weekly price predictions with confidence intervals and key support/resistance levels Line chart showing weekly price predictions with confidence intervals and key support/resistance levels](/assets/analysis/796d5467-cf91-4146-989d-62b6b8d59a02//88fe3949-ddd8-42fb-92b5-26e19eae98b2.png)
Monthly Analysis Reveals Potential Price Stabilization with Moderate Downside Risk
![Line chart showing monthly price predictions with confidence intervals and trend analysis Line chart showing monthly price predictions with confidence intervals and trend analysis](/assets/analysis/796d5467-cf91-4146-989d-62b6b8d59a02//64c75a6f-96ae-4482-9616-0eac3654faec.png)