Saving...
FTSE 100 Market Analysis and Trading Insights
Saving...
FTSE 100 Shows Bullish Momentum but Volume Warning Signs
Saving...
FTSE 100 Shows Bullish Momentum but Volume Warning Signs
Saving...
Saving...
Key Price Levels Set Clear Trading Parameters
Saving...
Key Price Levels Set Clear Trading Parameters
Saving...
Saving...
Trading Strategy Most Effective in Low Volatility Conditions
Saving...
Trading Strategy Most Effective in Low Volatility Conditions
Saving...
Saving...
Optimal Entry Points Identified Through Moving Averages
Saving...
Optimal Entry Points Identified Through Moving Averages
Saving...
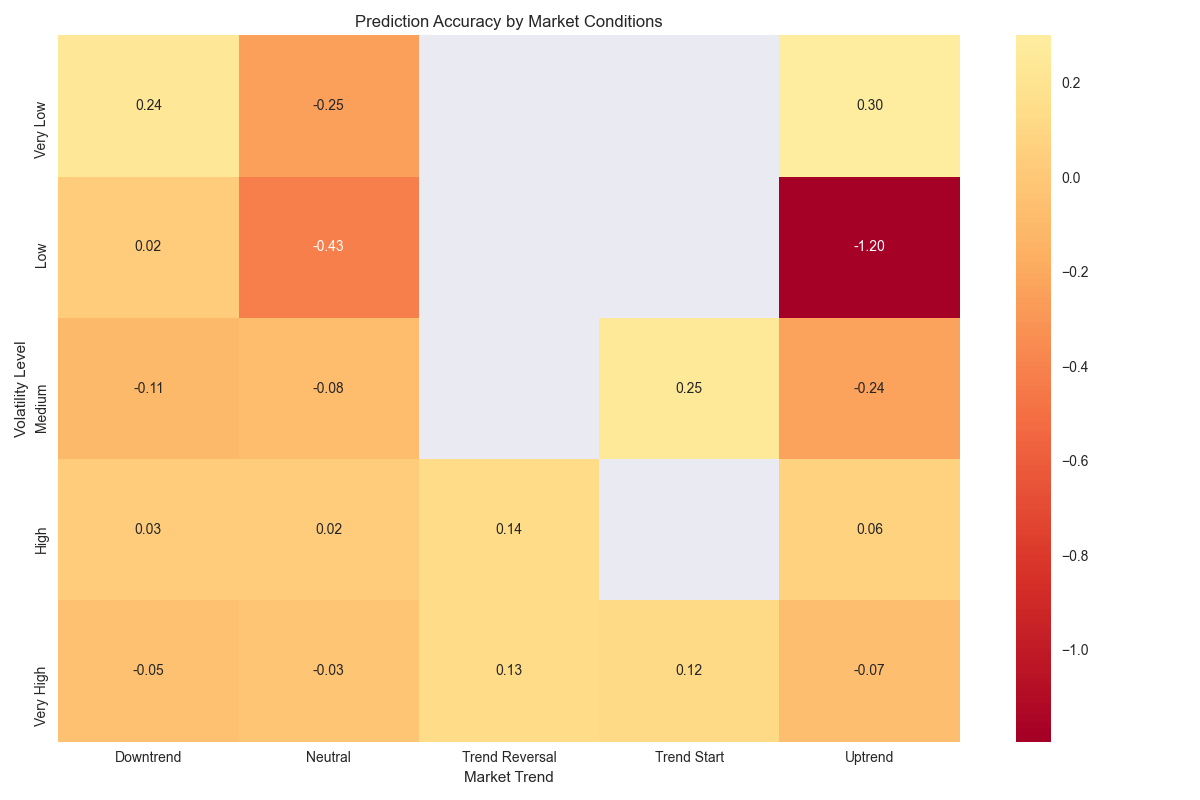
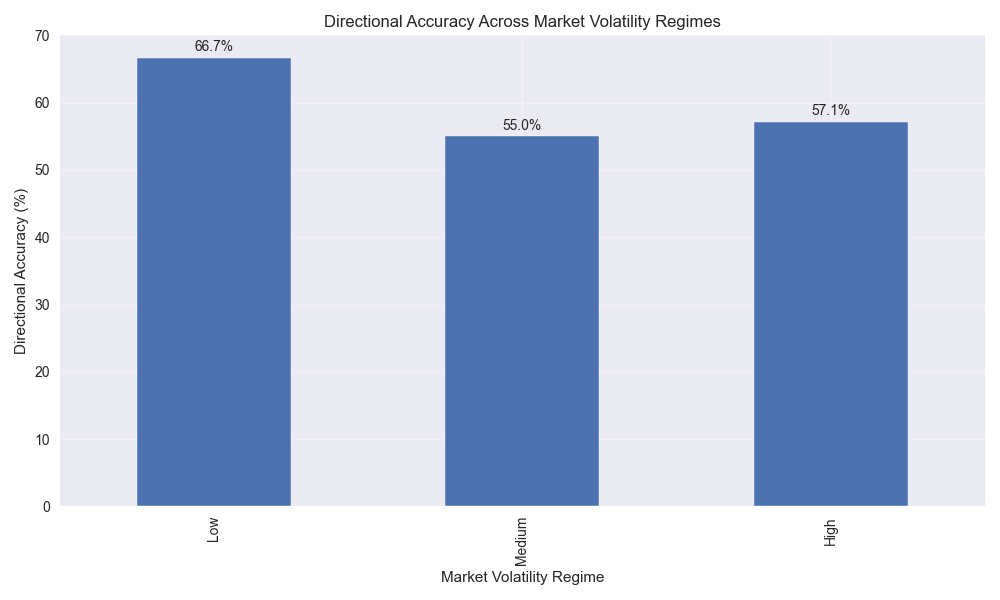
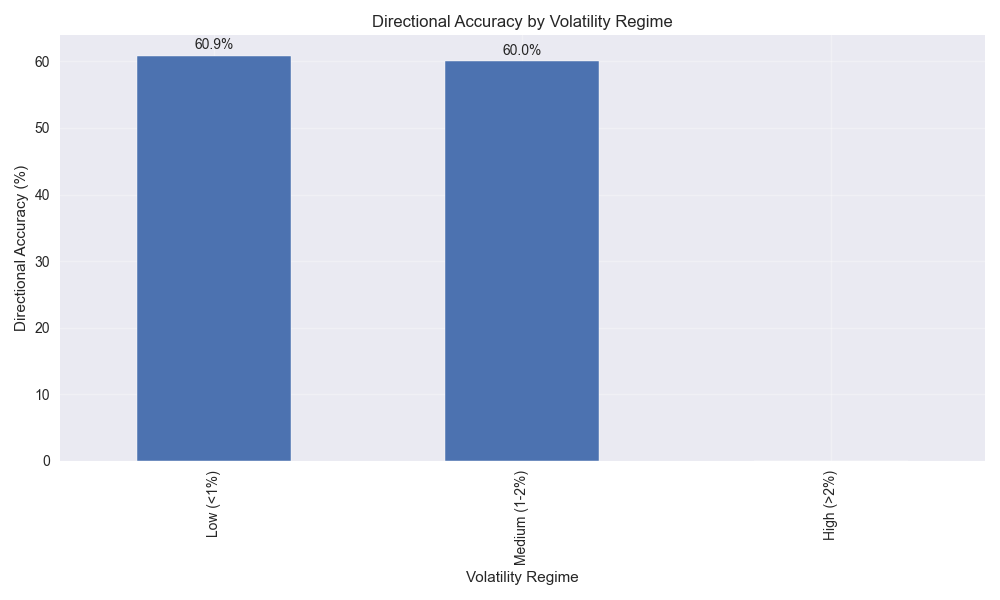
FTSE 100 Technical Analysis and Market Trend Impact on Predictions
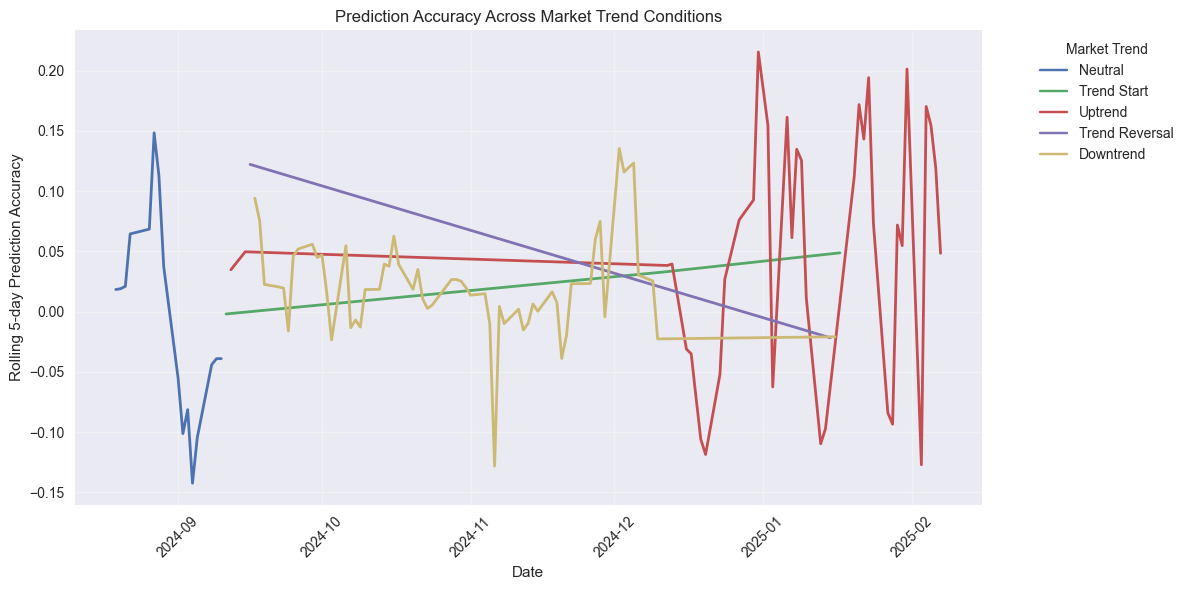
![Line plot showing how prediction accuracy varies across different market trend conditions over time. Line plot showing how prediction accuracy varies across different market trend conditions over time.](/assets/analysis/013ad5df-0673-4f39-9c4b-cd427012d6e2//1f2a1ccf-d576-4d31-92cf-ba59fd4b612d.png)
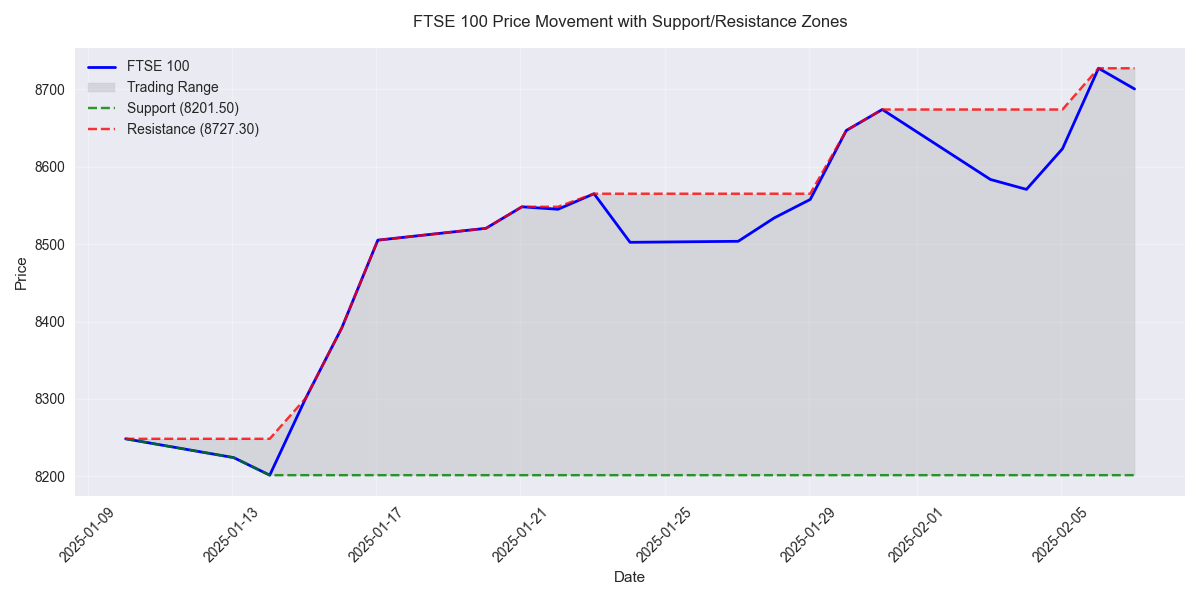
Key Support and Resistance Levels Signal Strong Technical Framework
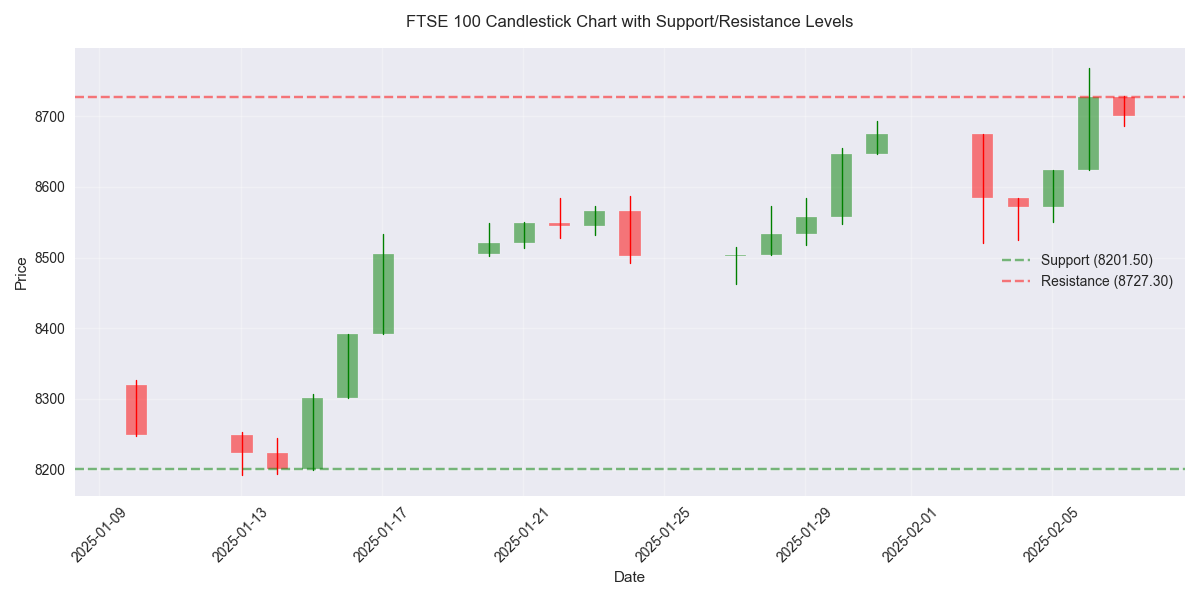
![FTSE 100 candlestick chart showing price action with key support and resistance levels highlighted. FTSE 100 candlestick chart showing price action with key support and resistance levels highlighted.](/assets/analysis/013ad5df-0673-4f39-9c4b-cd427012d6e2//87f26233-1670-4b6c-9bf7-87eaa901eb48.png)
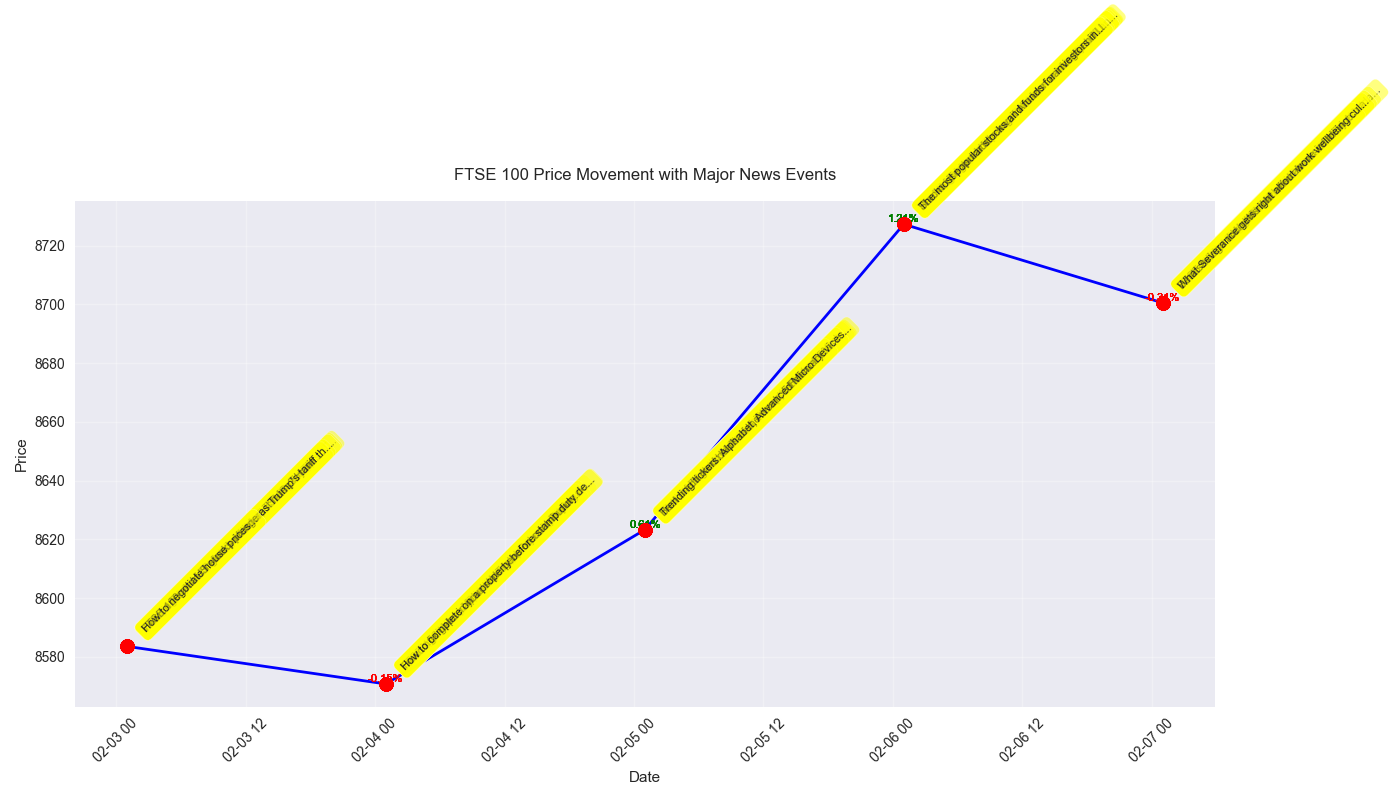
Market Sentiment Analysis Reveals Mixed Signals Amid Trade Tensions
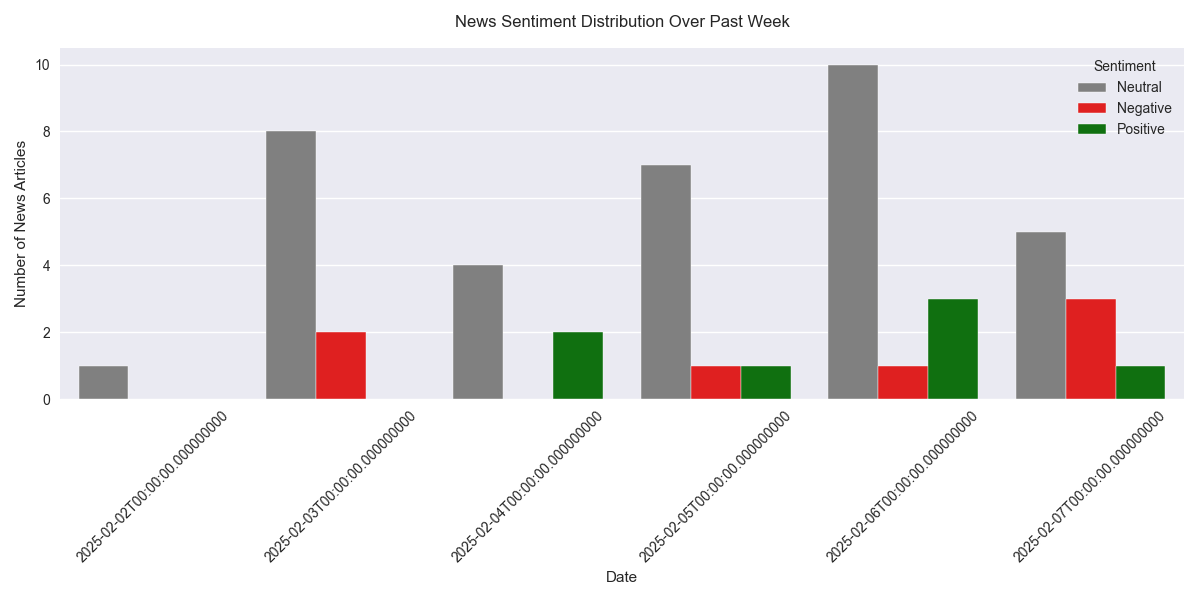
![Distribution of news sentiment affecting FTSE 100 over the past week. Distribution of news sentiment affecting FTSE 100 over the past week.](/assets/analysis/013ad5df-0673-4f39-9c4b-cd427012d6e2//9d07a64b-834c-49e0-8409-490e9a1eac8b.png)
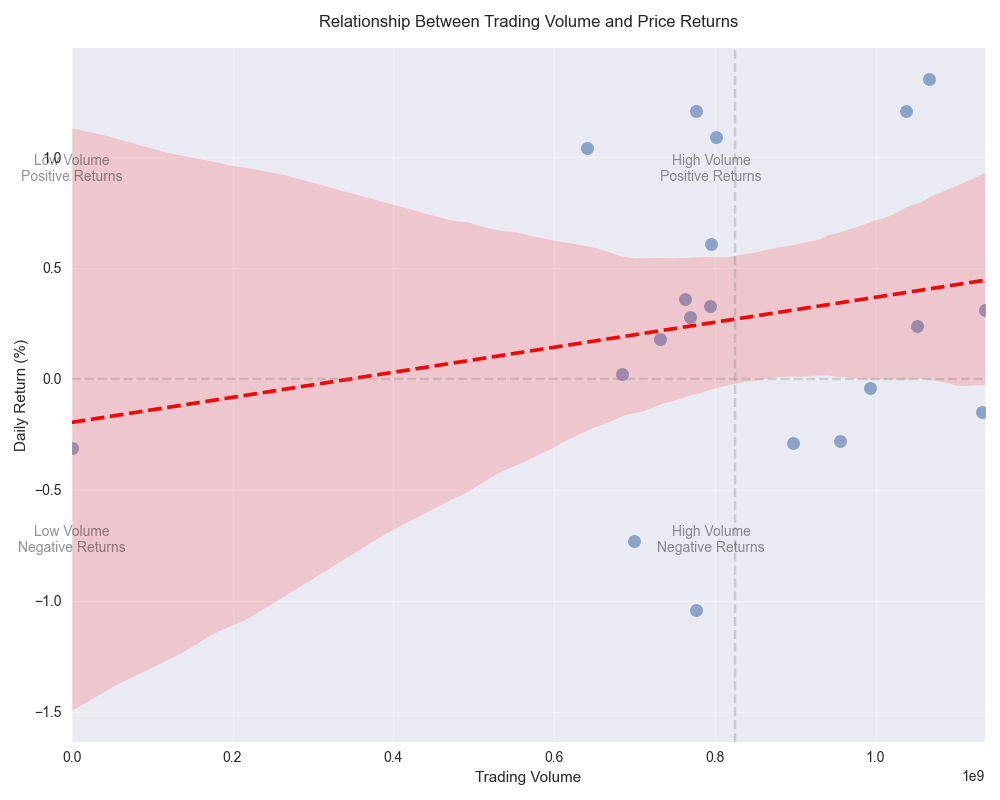
Volume Analysis Reveals Declining Trading Activity Despite Price Gains
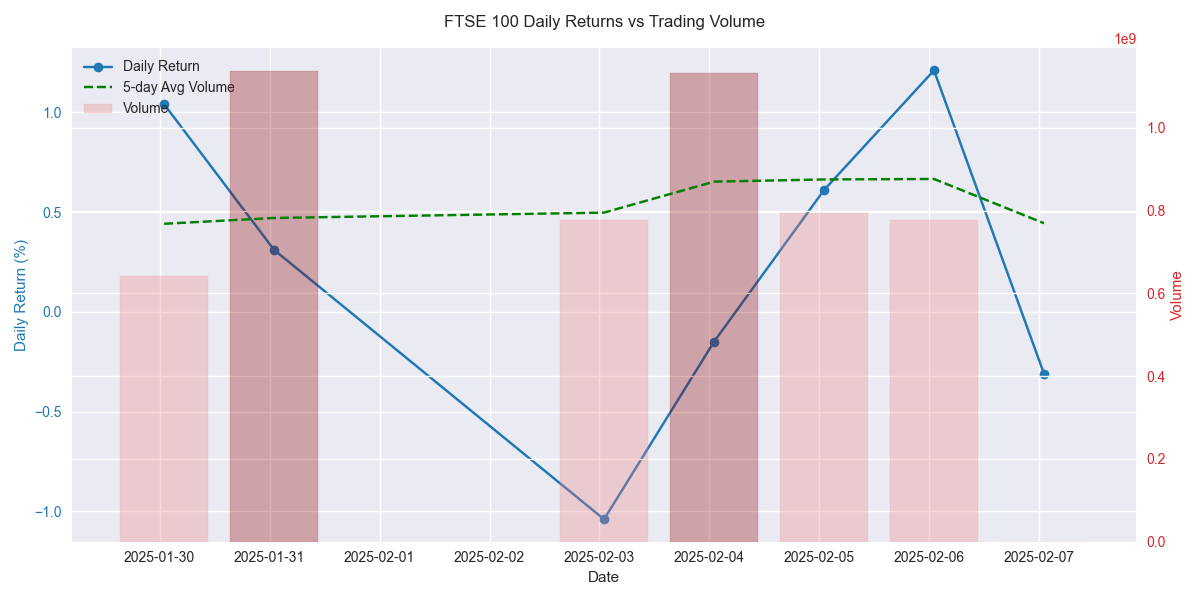
![Daily price returns plotted against trading volume with 5-day average volume threshold. Daily price returns plotted against trading volume with 5-day average volume threshold.](/assets/analysis/013ad5df-0673-4f39-9c4b-cd427012d6e2//b76eca6f-e104-4a13-8377-065d3a9e93f2.png)
Initial FTSE 100 Daily Returns Prediction Model Performance
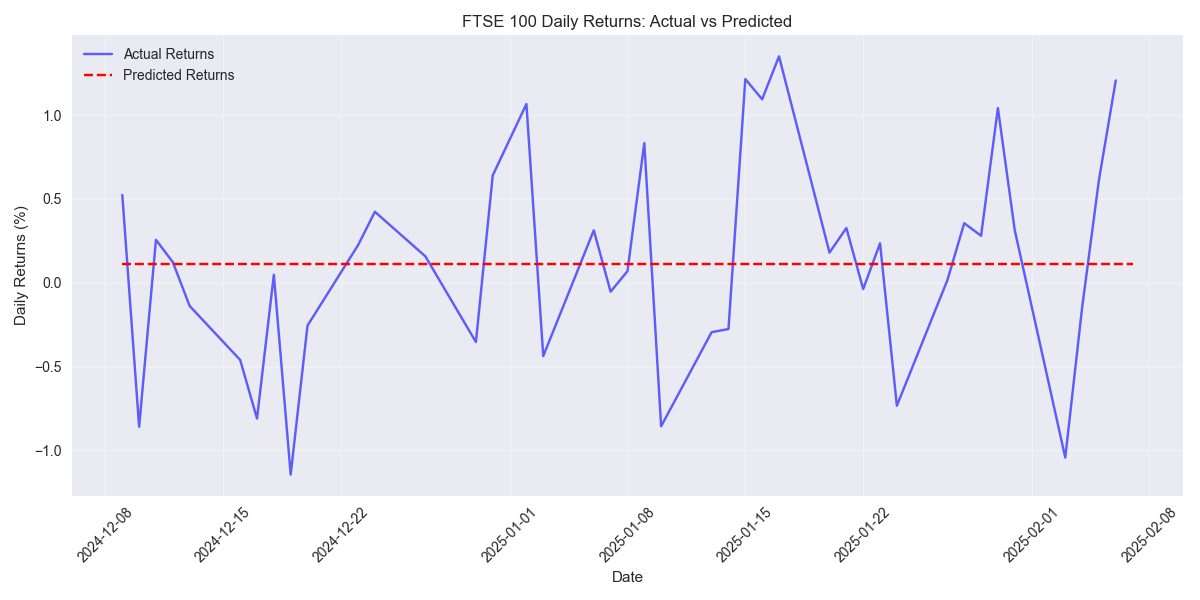
![Comparison of actual vs predicted daily returns for FTSE 100 over time, showing the model's ability to capture market movements. Comparison of actual vs predicted daily returns for FTSE 100 over time, showing the model's ability to capture market movements.](/assets/analysis/013ad5df-0673-4f39-9c4b-cd427012d6e2//eaa4dd8d-4a77-4dcd-b863-b4d33007e831.png)
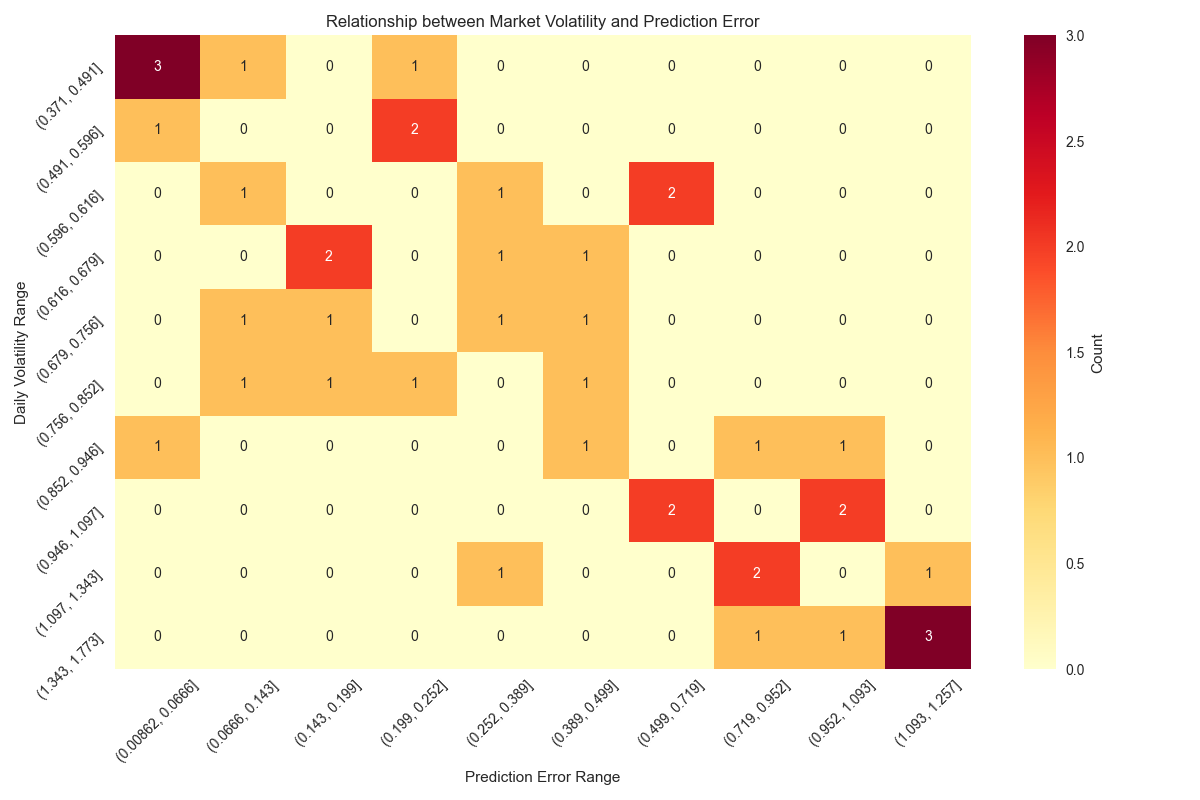
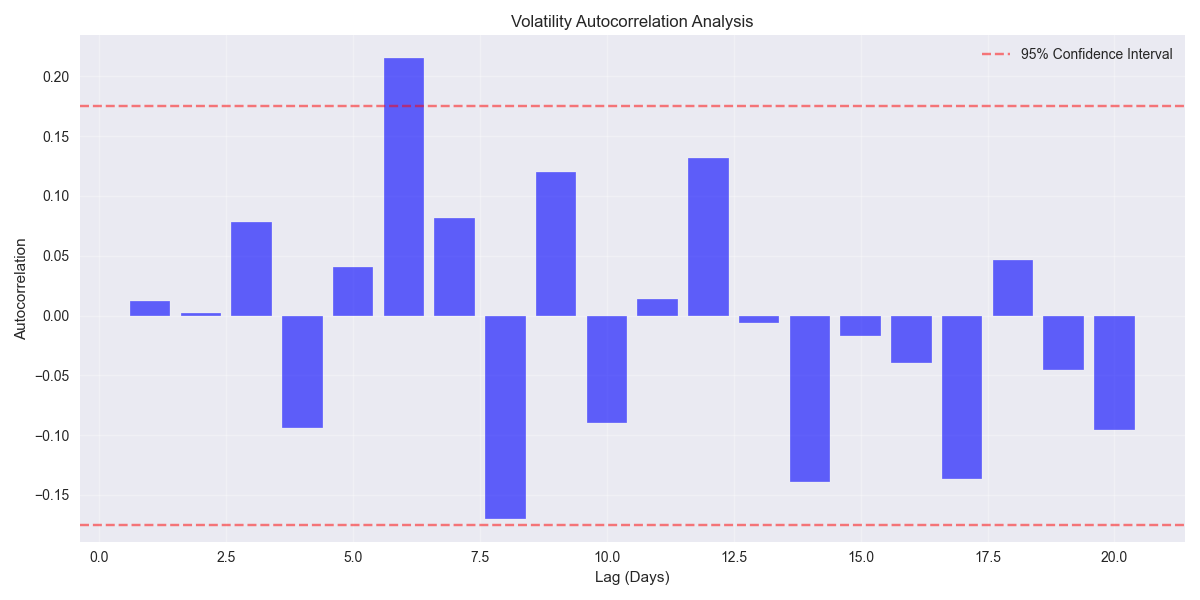
FTSE 100 Volatility and Risk Analysis
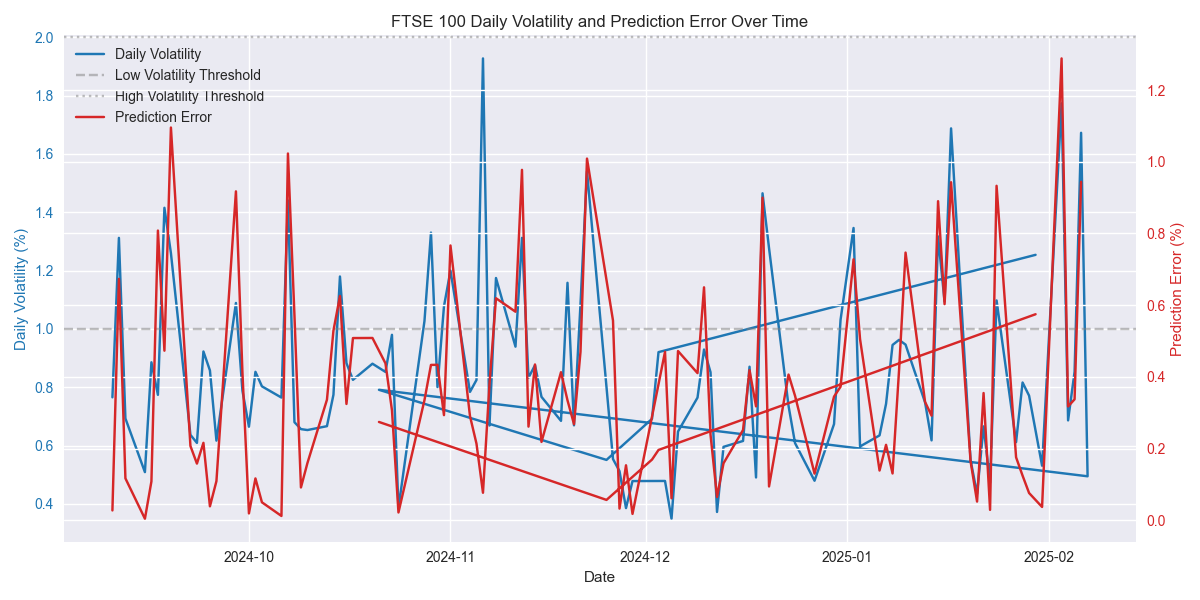
![Time series visualization showing the relationship between daily market volatility levels and prediction error over time, with highlighted thresholds for low and high volatility periods. Time series visualization showing the relationship between daily market volatility levels and prediction error over time, with highlighted thresholds for low and high volatility periods.](/assets/analysis/013ad5df-0673-4f39-9c4b-cd427012d6e2//4487a731-6523-495f-8109-cd957d74faf4.png)
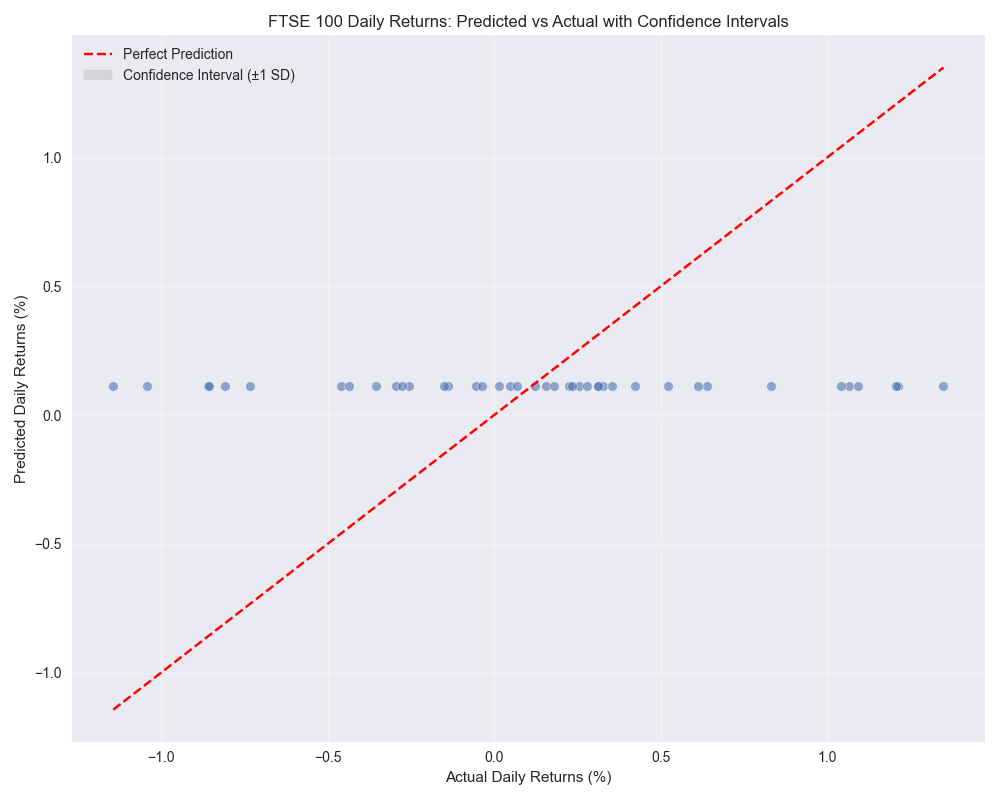
FTSE 100 Short-term Price Prediction Analysis
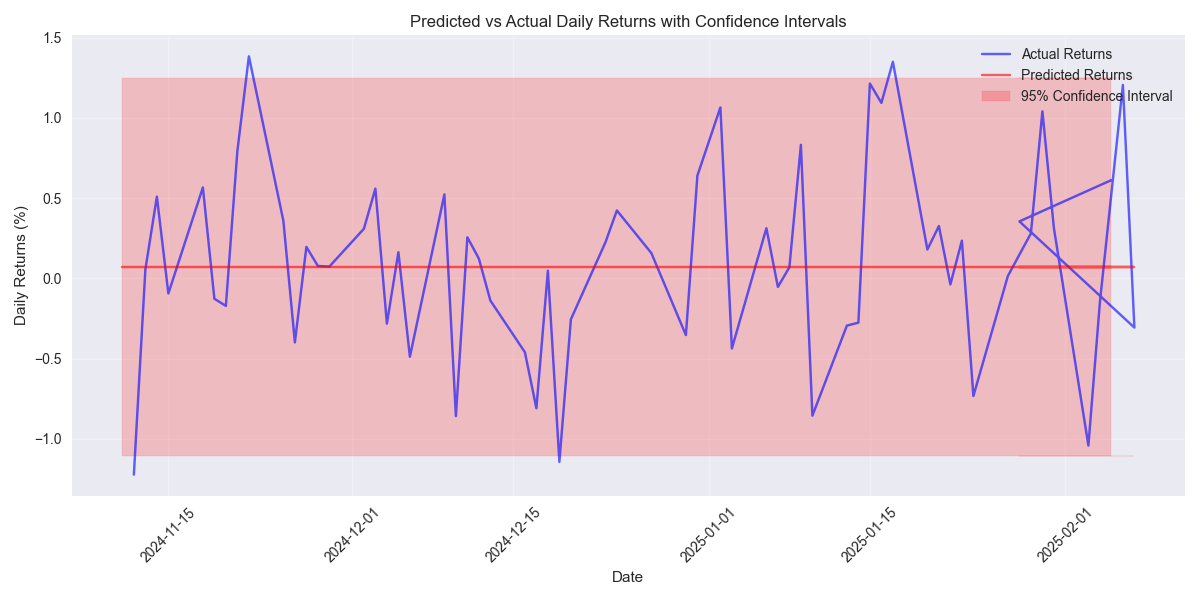
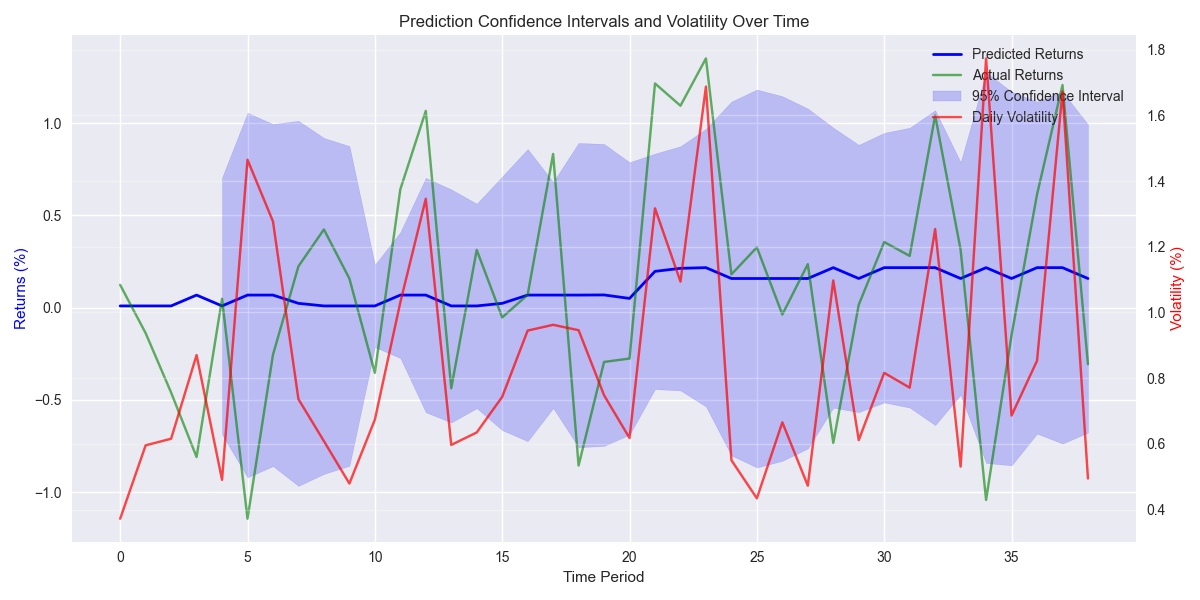
![Comparison of predicted vs actual daily returns over time, showing the model's prediction accuracy and confidence intervals. Comparison of predicted vs actual daily returns over time, showing the model's prediction accuracy and confidence intervals.](/assets/analysis/013ad5df-0673-4f39-9c4b-cd427012d6e2//d087688d-029e-44b7-995b-675954c15a4a.png)
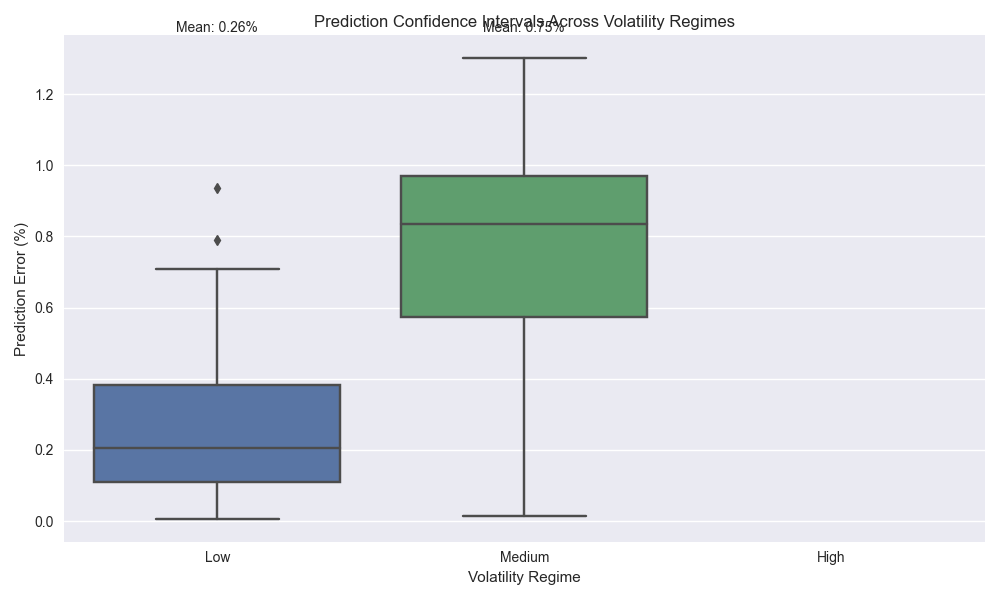
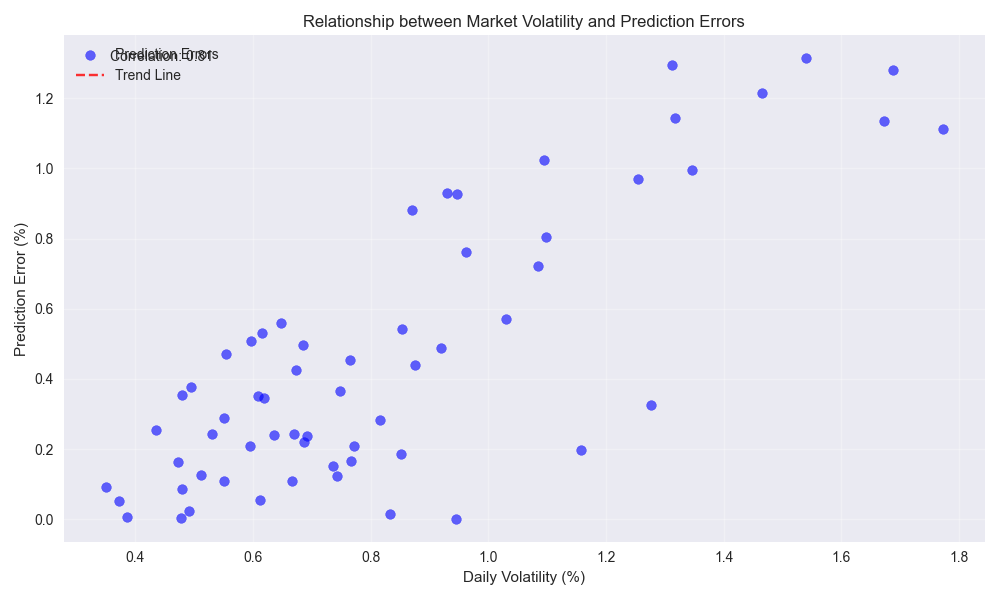
FTSE 100 Volatility Impact on Prediction Confidence
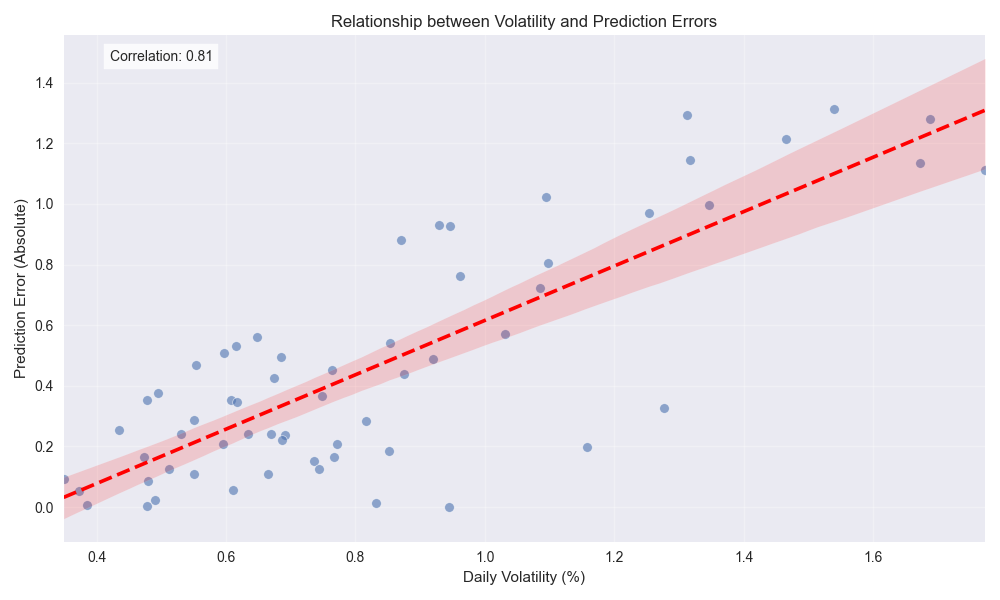
![Scatter plot illustrating the relationship between daily market volatility and prediction errors, with a trend line showing the overall correlation. Scatter plot illustrating the relationship between daily market volatility and prediction errors, with a trend line showing the overall correlation.](/assets/analysis/013ad5df-0673-4f39-9c4b-cd427012d6e2//af93e6ee-8ac3-4abe-abd4-71a0f1eac4e7.png)
FTSE 100 Shows Strong Bullish Momentum with Key Technical Signals
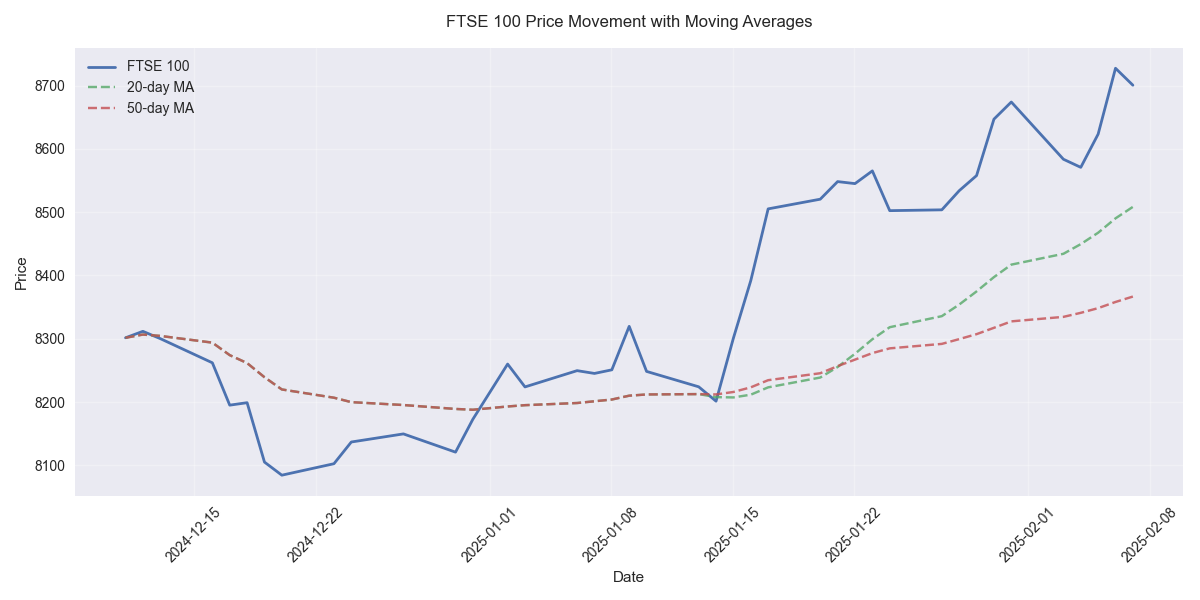
![FTSE 100 price movements with 20-day and 50-day moving averages showing bullish trend with price above both moving averages. FTSE 100 price movements with 20-day and 50-day moving averages showing bullish trend with price above both moving averages.](/assets/analysis/013ad5df-0673-4f39-9c4b-cd427012d6e2//7b66c36d-a48a-47f4-9537-e7a5dc10e6cd.png)