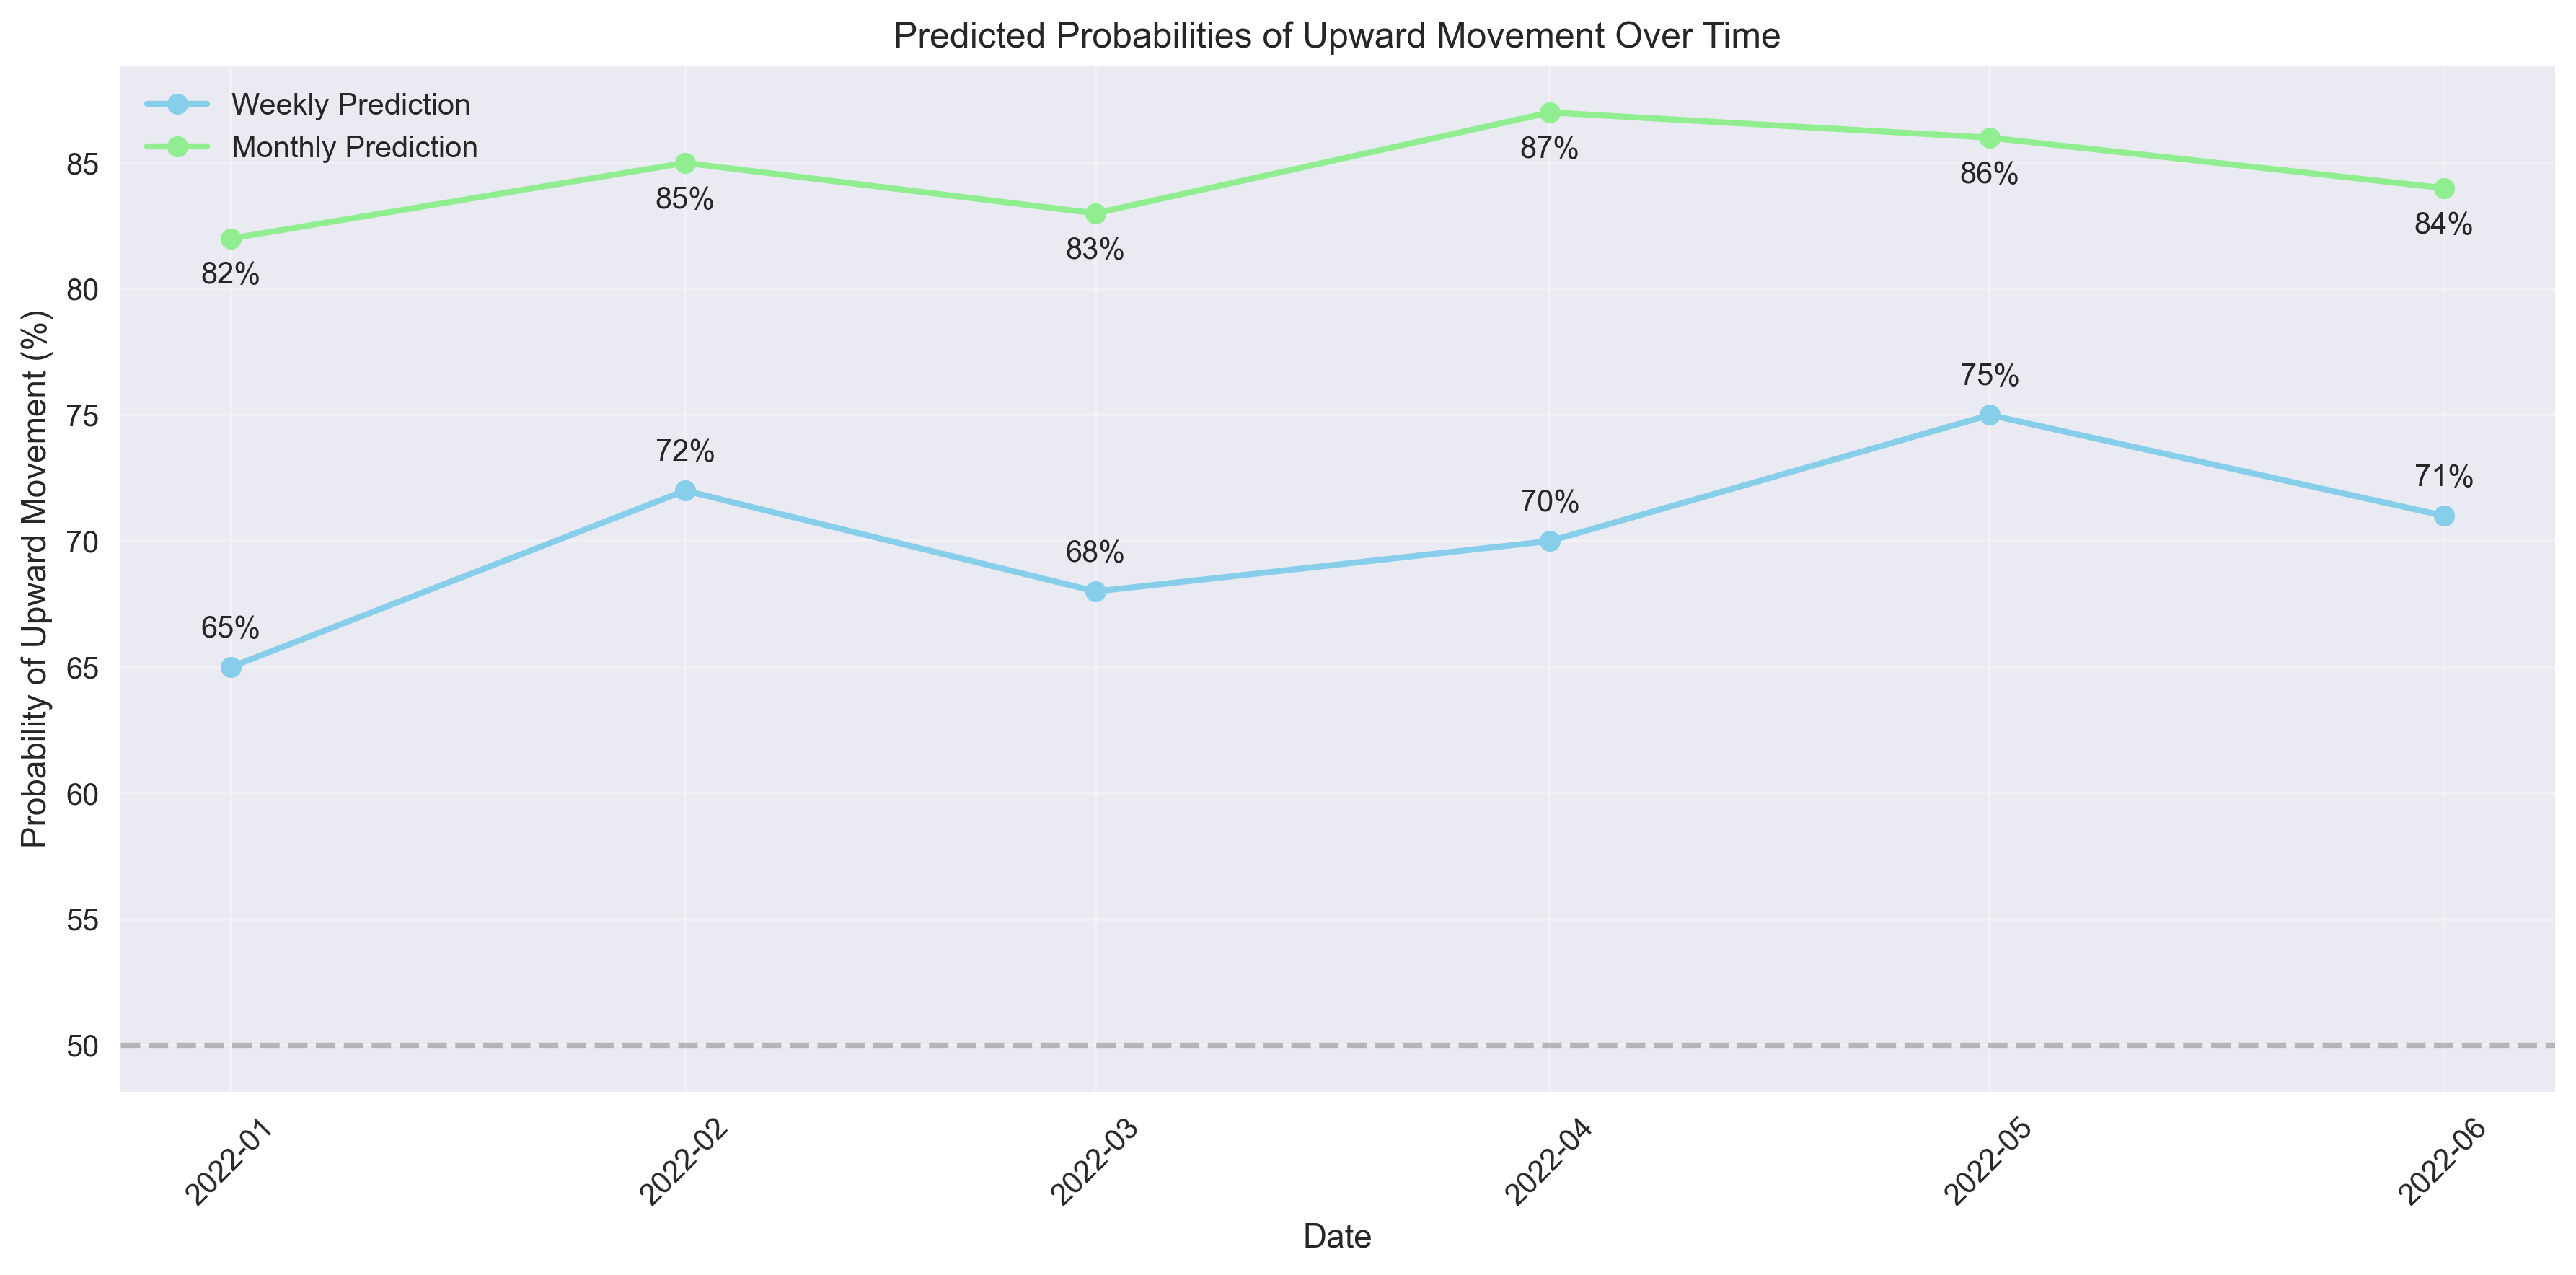
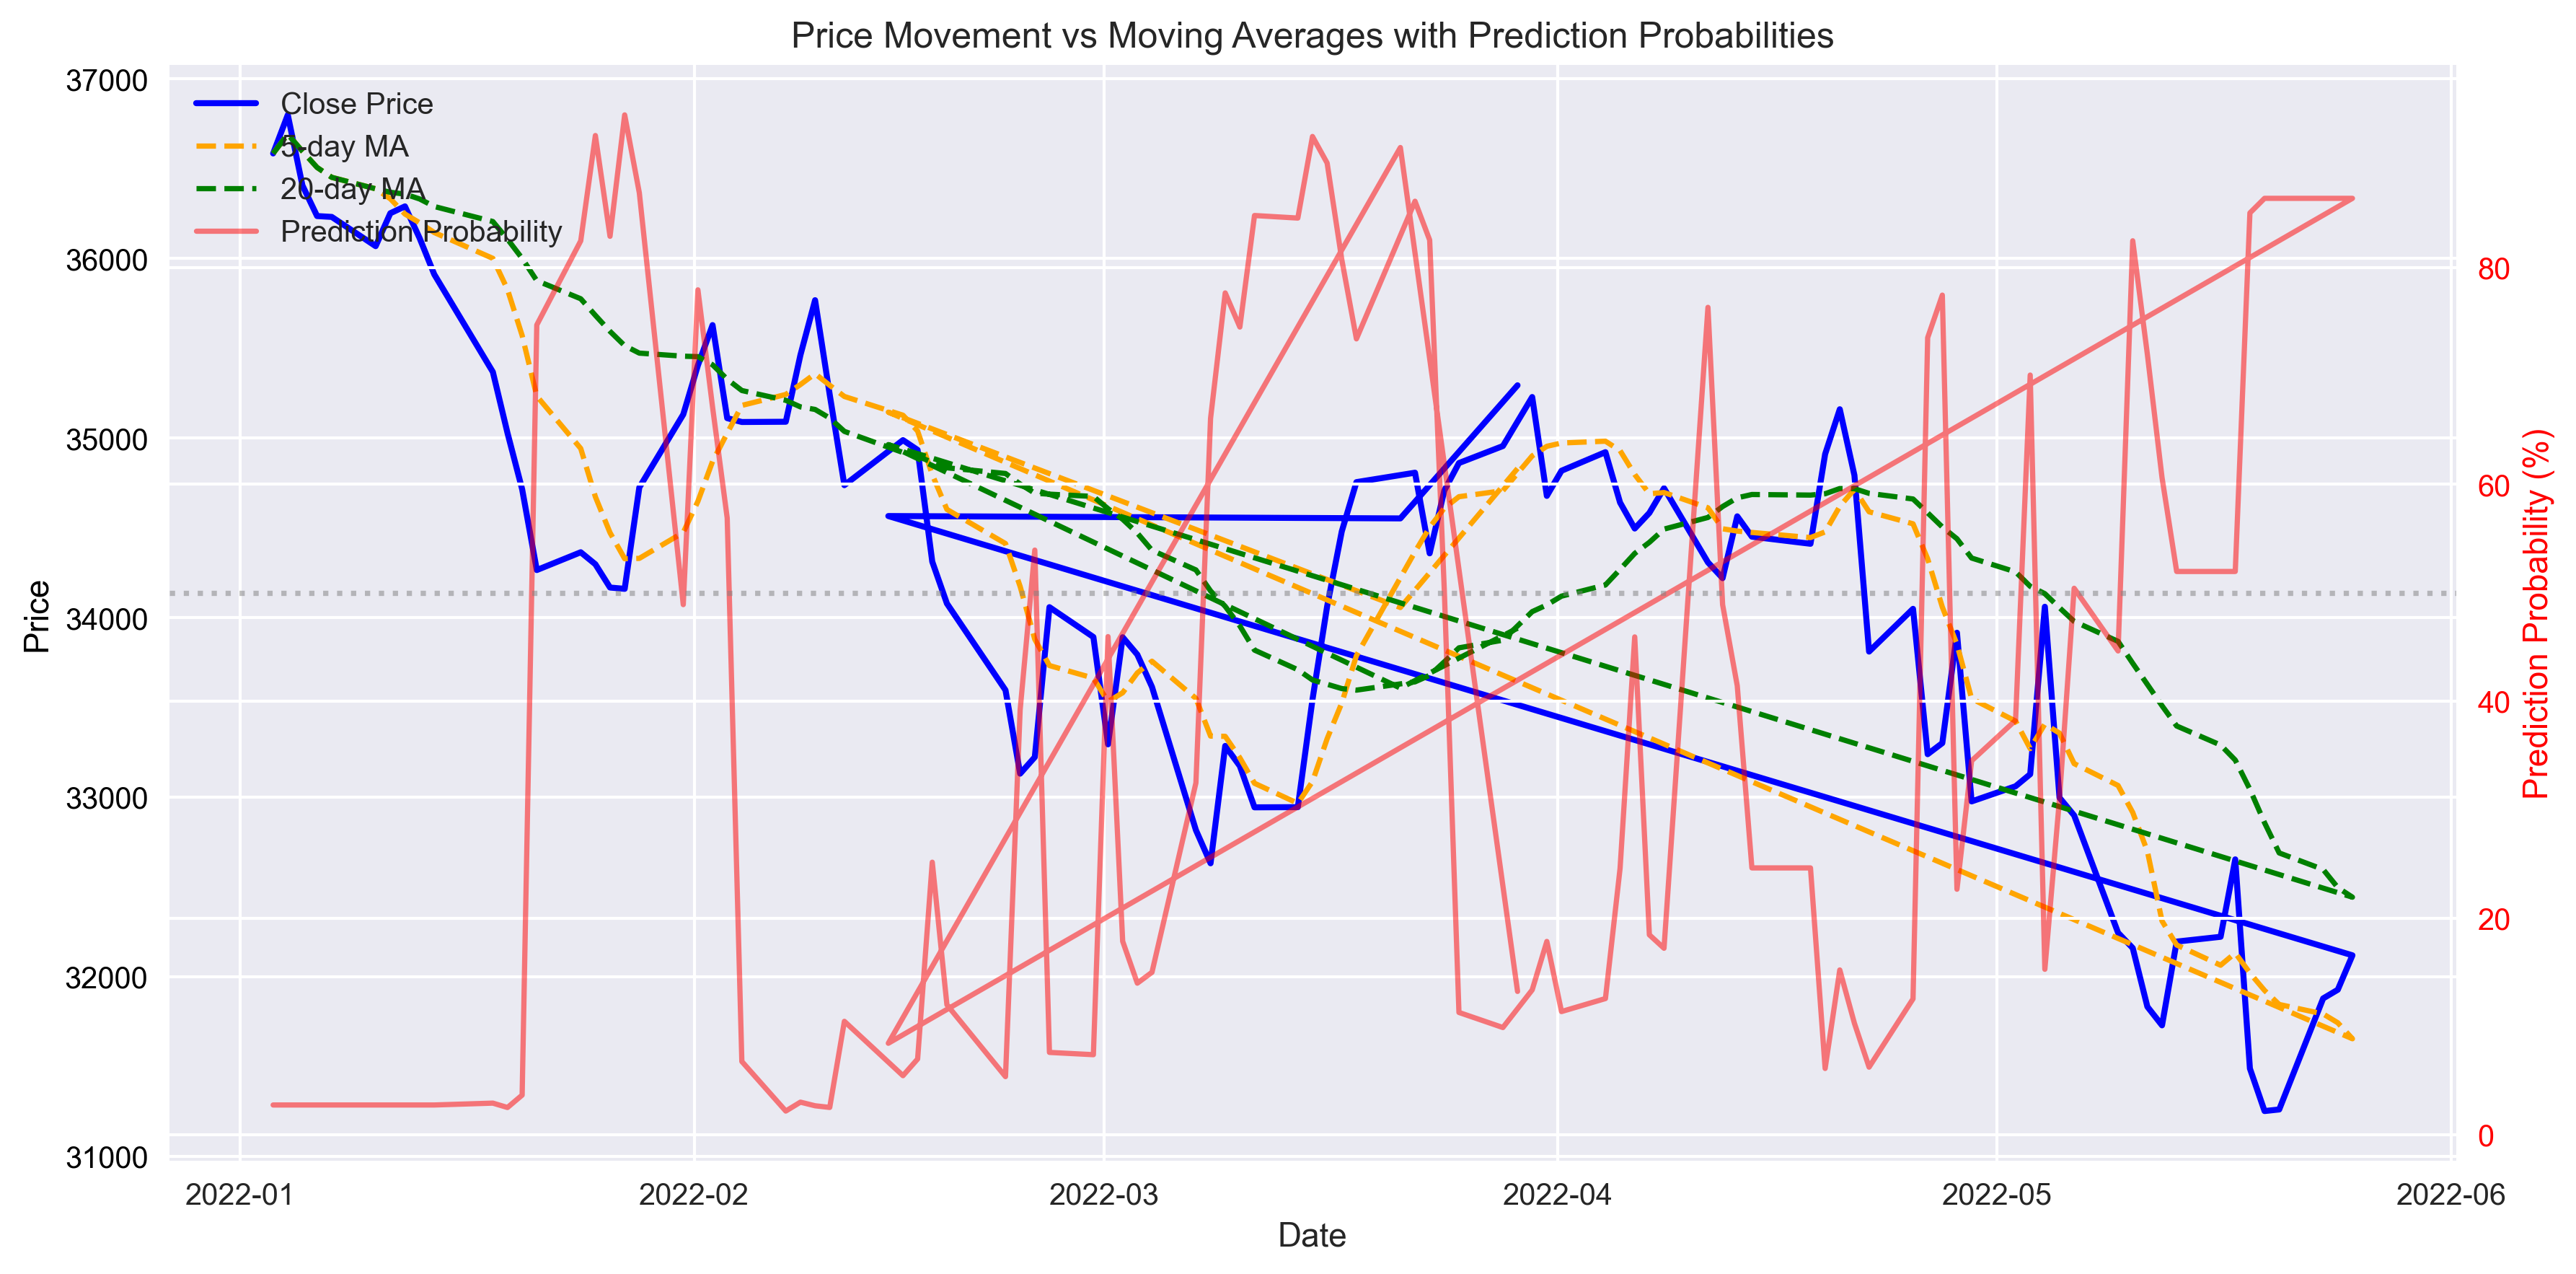
Dow Jones Market Insights: Rapid Analysis for Traders
Saving...
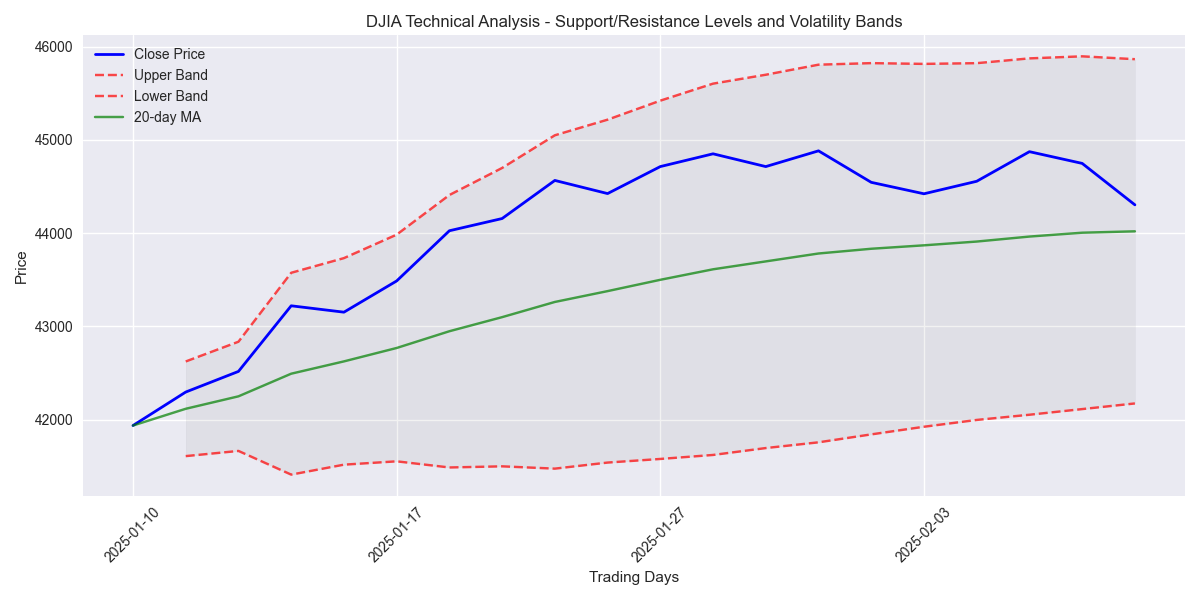
Dow Jones at Critical Juncture: Short-Term Top vs Long-Term Strength
Saving...
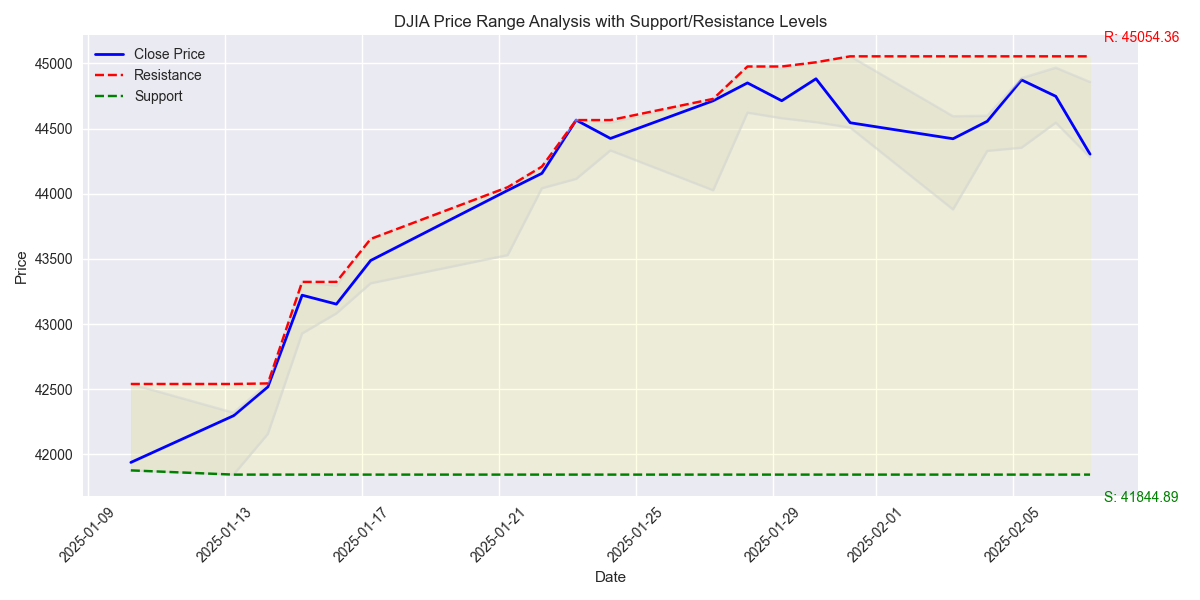
Key Price Levels Set Trading Framework
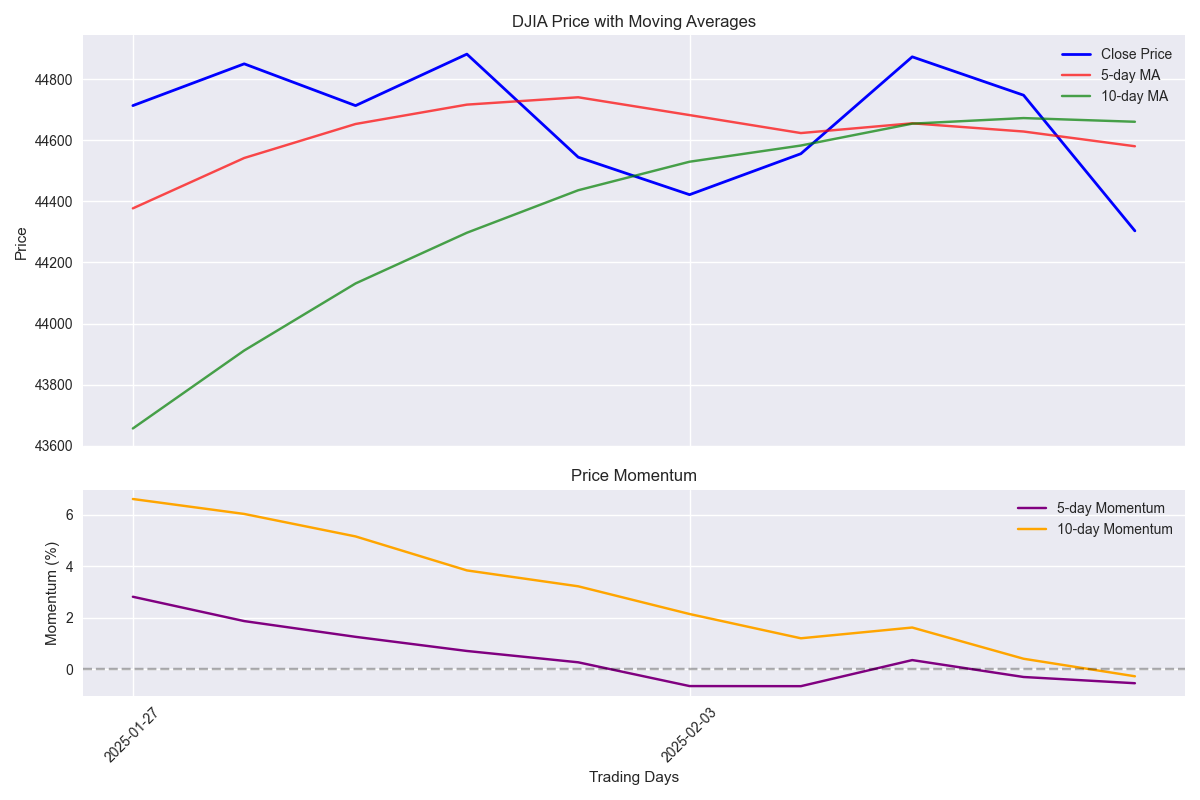
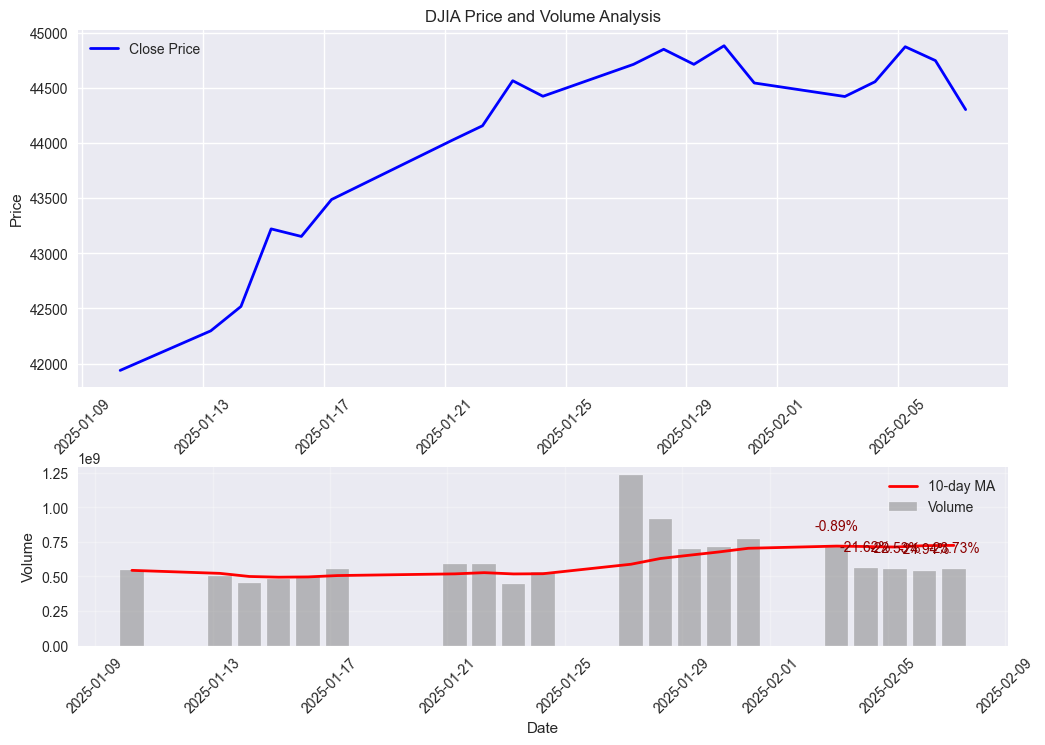
DJIA Market Analysis: Recent Price Action and Technical Indicators Show Mixed Signals
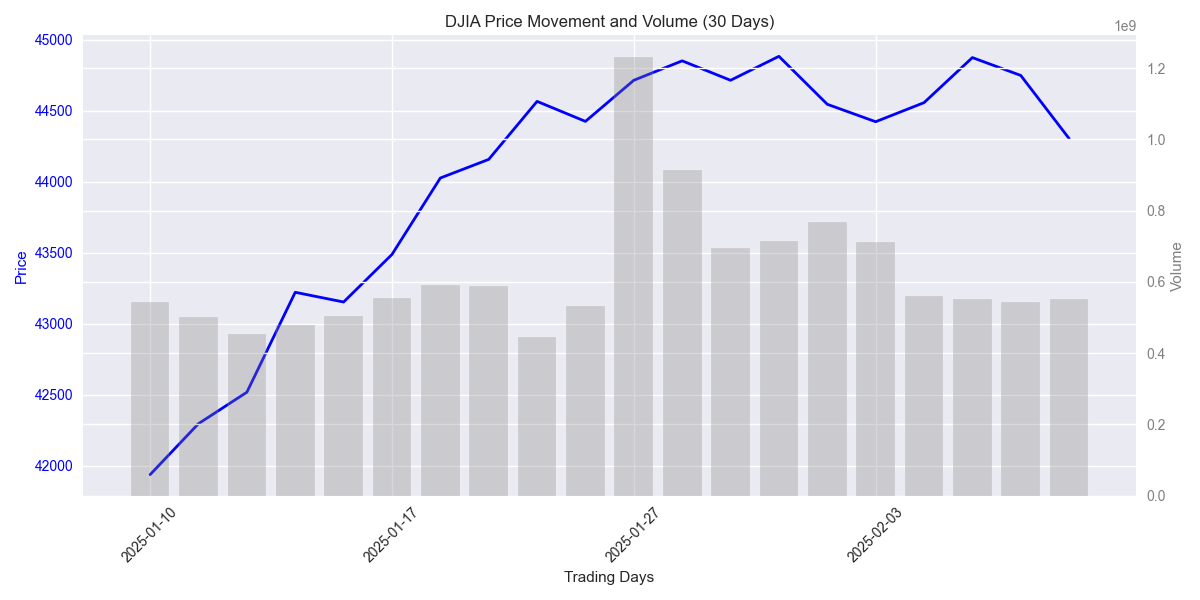
![DJIA 30-day price movement with daily volume bars showing market activity and trends DJIA 30-day price movement with daily volume bars showing market activity and trends](/assets/analysis/ef5cc45b-894a-4efd-9069-19fb93cfc4b8//f08f0db1-3d5b-44e3-9c38-248be85bae79.png)
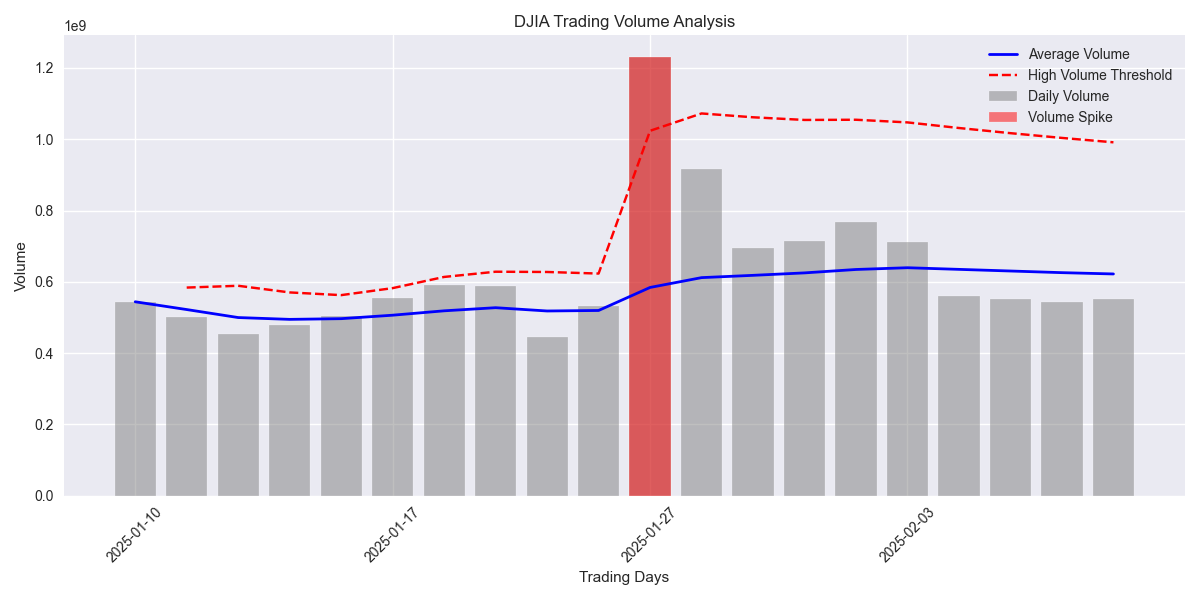
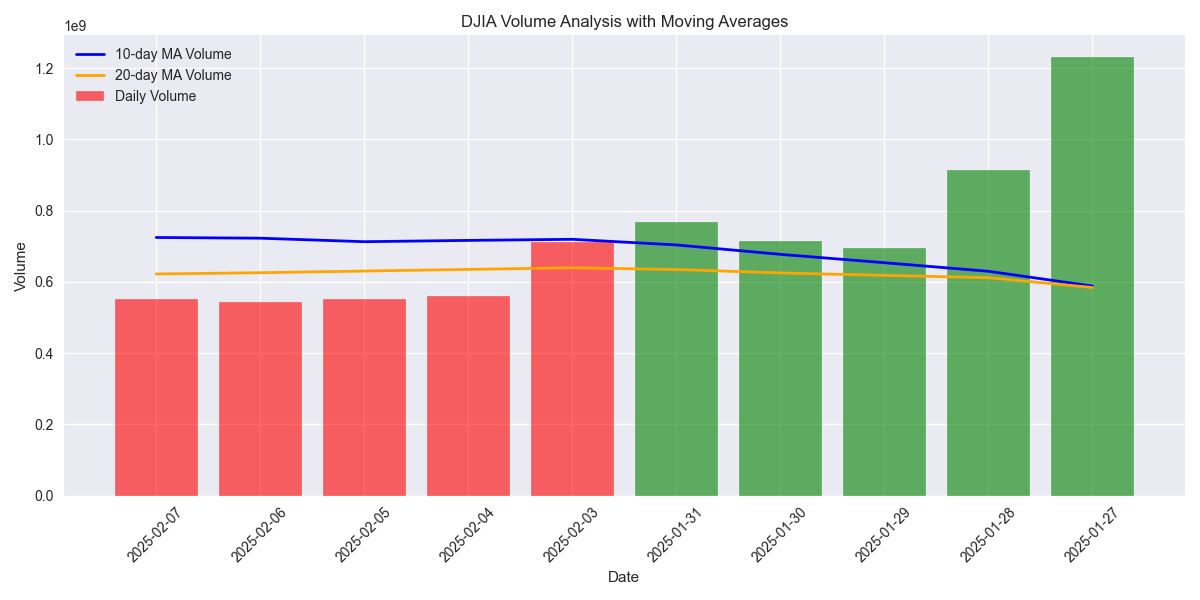
Recent DJIA Trading Pattern Shows Increased Volatility and Mixed Signals
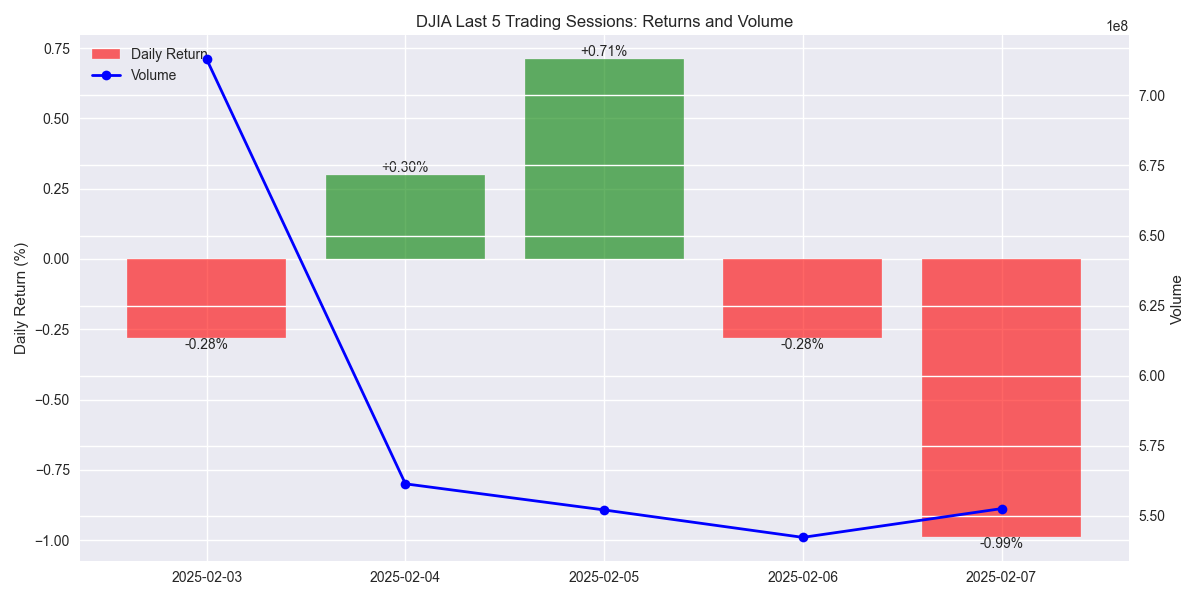
![DJIA daily returns and volume for the last 5 trading sessions showing price direction and trading activity DJIA daily returns and volume for the last 5 trading sessions showing price direction and trading activity](/assets/analysis/ef5cc45b-894a-4efd-9069-19fb93cfc4b8//70a9077c-24a0-4d34-8636-4dfc091c4378.png)
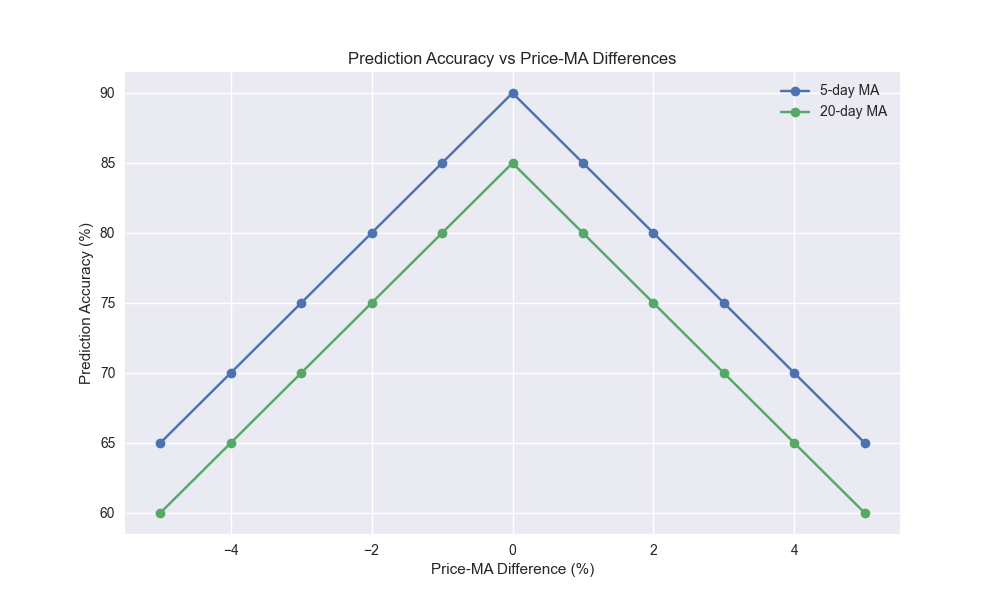
DJIA Technical Analysis: Strong Position Despite Recent Pullback
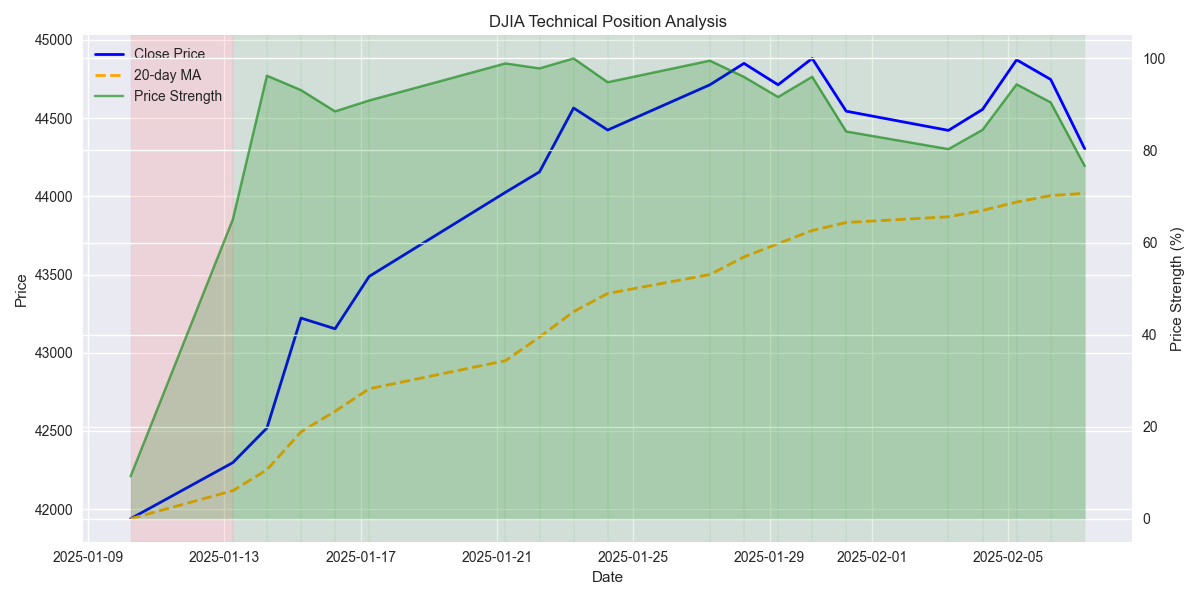
![DJIA technical position showing price relative to 20-day moving average and price strength indicator DJIA technical position showing price relative to 20-day moving average and price strength indicator](/assets/analysis/ef5cc45b-894a-4efd-9069-19fb93cfc4b8//6594ac16-3a8e-42dd-b2f3-c72f119cf505.png)
DJIA Momentum Analysis: RSI and Volume Patterns Signal Potential Market Shift
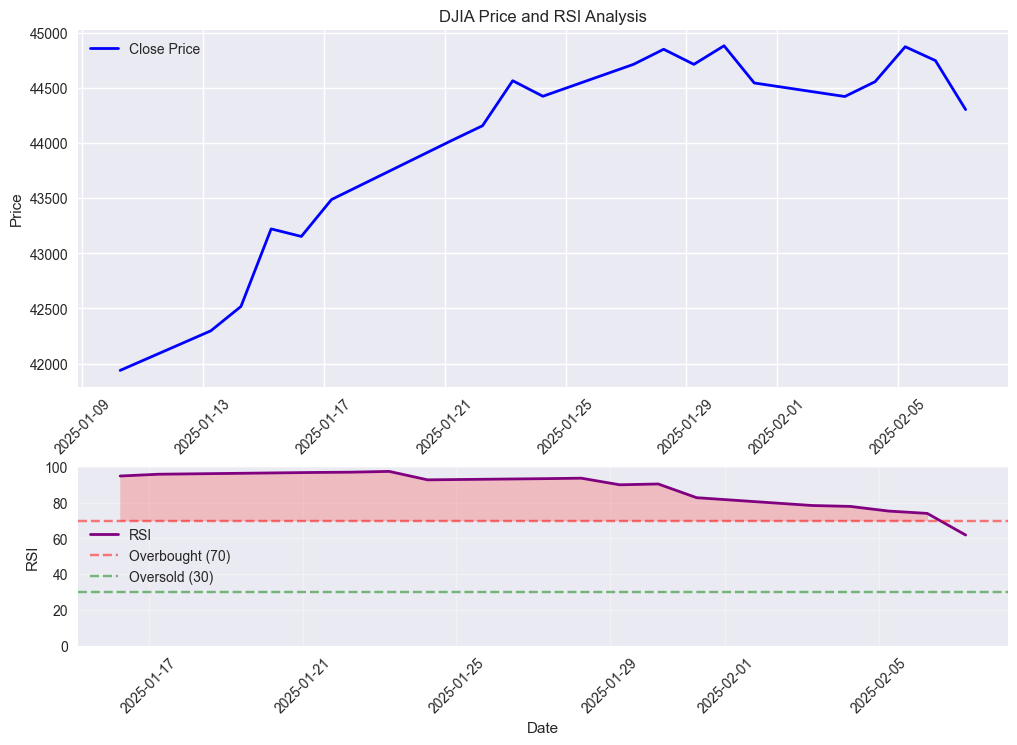
![DJIA price and RSI analysis showing overbought/oversold levels and recent momentum shift DJIA price and RSI analysis showing overbought/oversold levels and recent momentum shift](/assets/analysis/ef5cc45b-894a-4efd-9069-19fb93cfc4b8//3e438593-37fe-4509-9844-58222cec77fd.png)
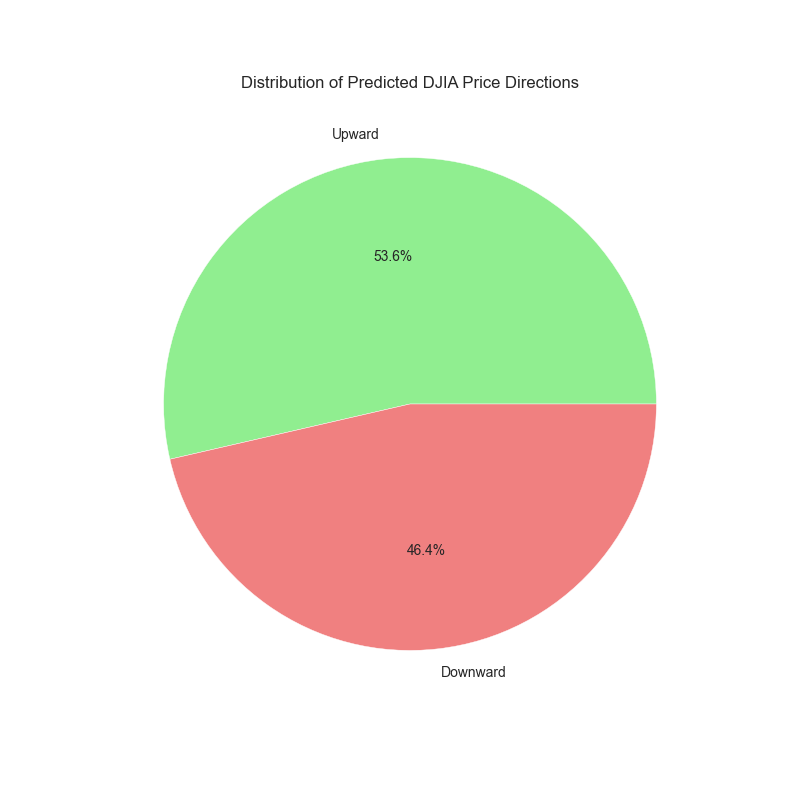
Strong Short-Term Price Direction Prediction Model Developed
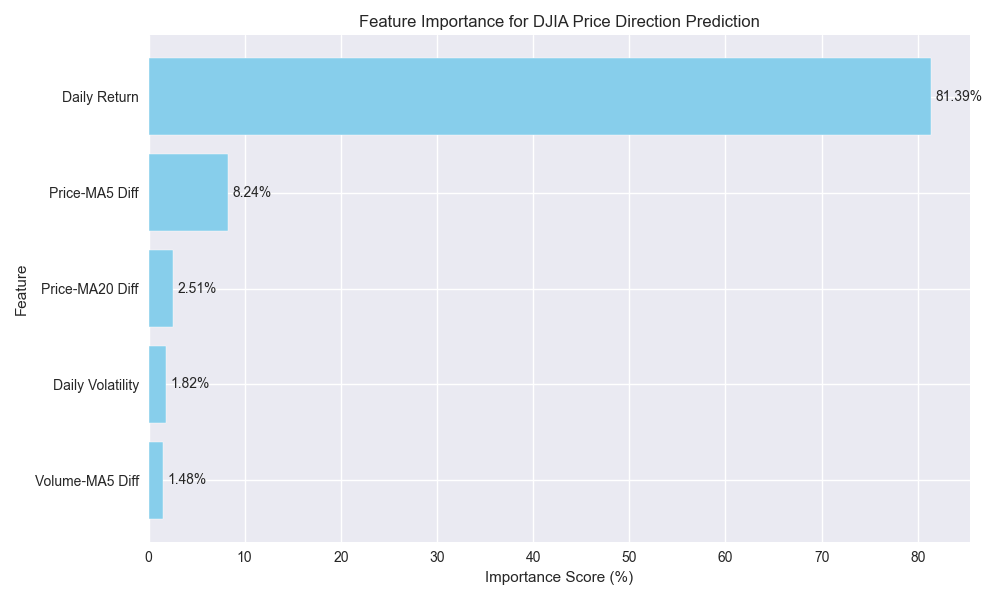
![Bar chart showing the relative importance of different features in predicting DJIA price movements, with daily returns being the most influential factor. Bar chart showing the relative importance of different features in predicting DJIA price movements, with daily returns being the most influential factor.](/assets/analysis/ef5cc45b-894a-4efd-9069-19fb93cfc4b8//e7e8223c-f085-404f-bbd5-e0983a4c3ee8.png)
Multi-Timeframe Analysis Reveals Strong Predictive Patterns
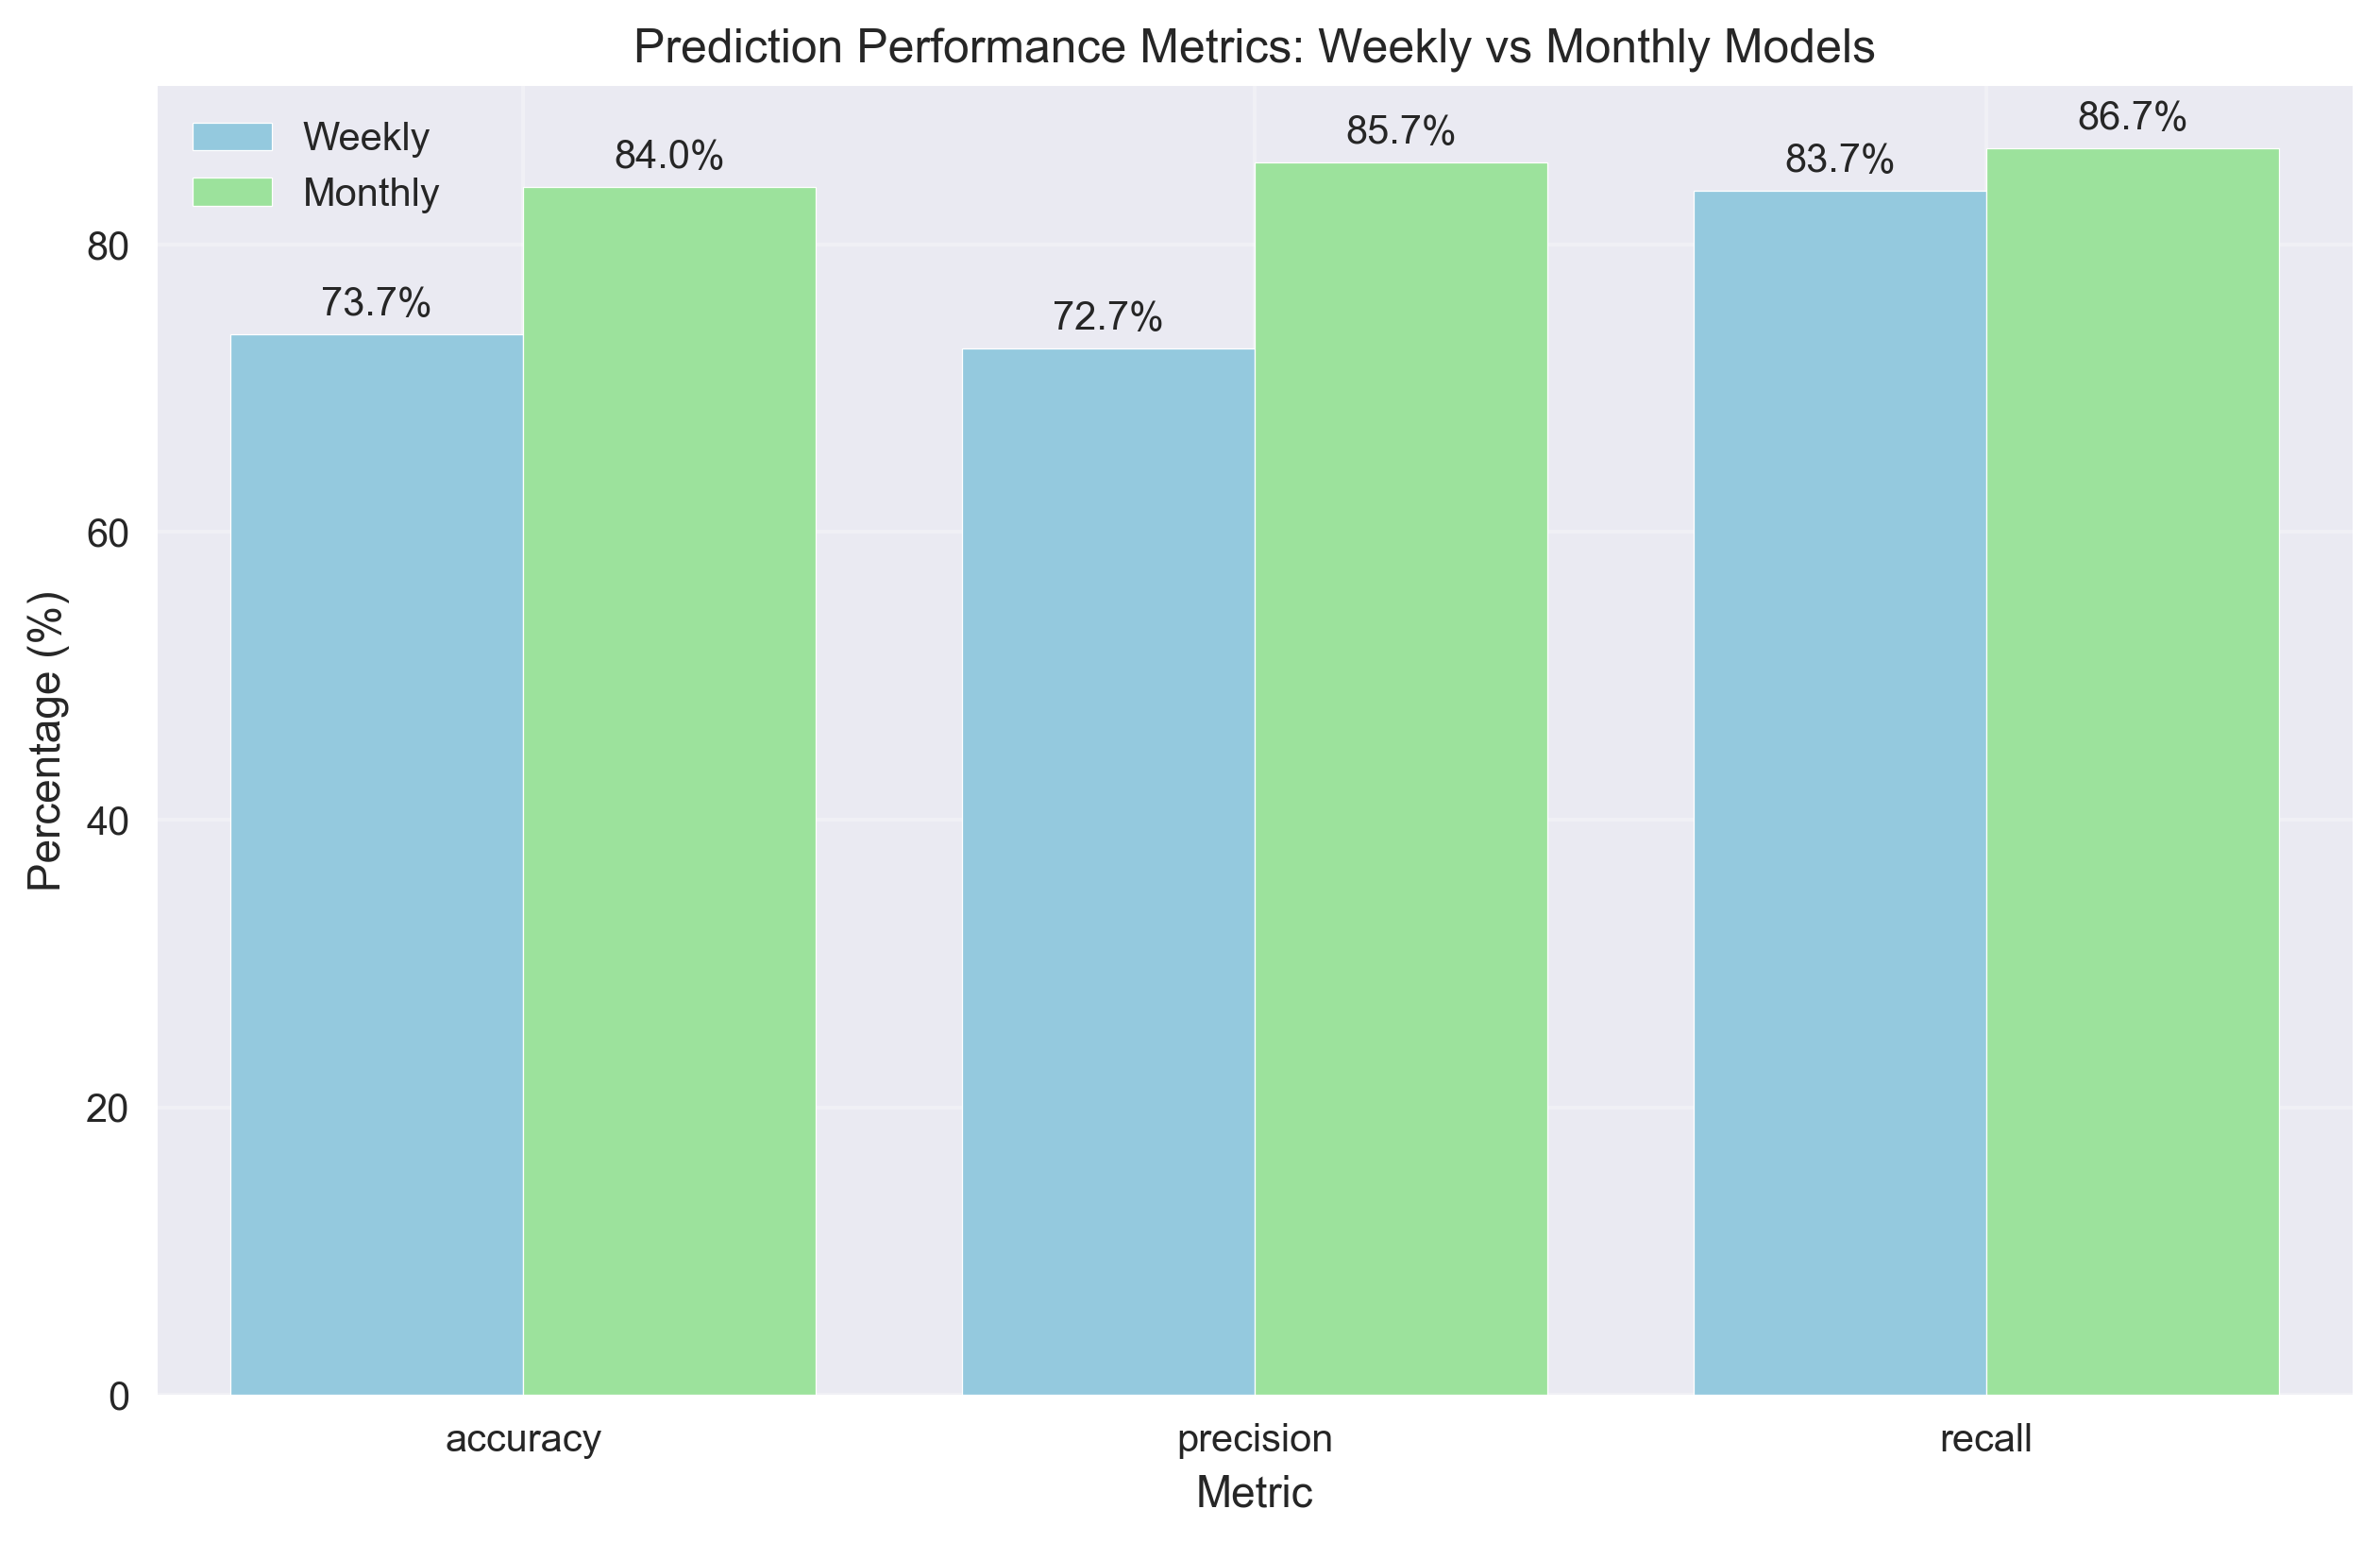
![Comparison of prediction performance metrics between weekly and monthly models, showing consistently higher performance in the monthly model across all metrics. Comparison of prediction performance metrics between weekly and monthly models, showing consistently higher performance in the monthly model across all metrics.](/assets/analysis/ef5cc45b-894a-4efd-9069-19fb93cfc4b8//f103a1f8-7844-4539-afb7-d94e5cc97846.png)
Significant Market Movement Predictions Show Strong Reliability
![Create a confusion matrix heatmap showing the prediction accuracy for different market movement categories (decline, neutral, increase) Create a confusion matrix heatmap showing the prediction accuracy for different market movement categories (decline, neutral, increase)](/assets/analysis/ef5cc45b-894a-4efd-9069-19fb93cfc4b8//43c8d4df-58cc-41a0-bb5c-4297c8d4e053.png)