Broadcom Briefing: Wall Street Remains Bullish
Saving...
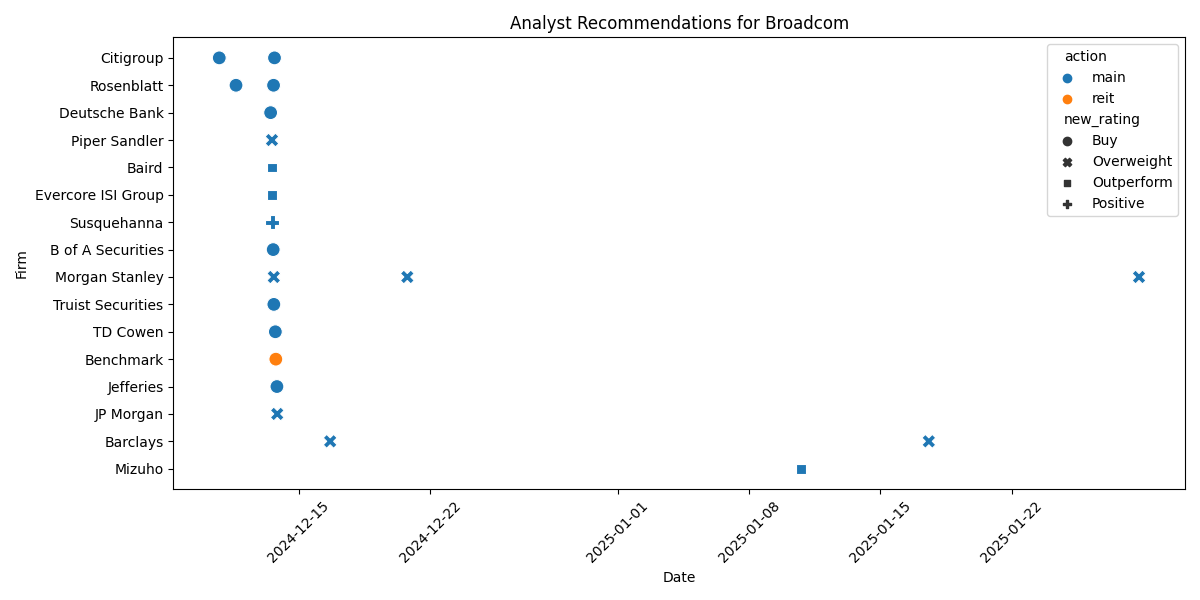
Wall Street Remains Bullish on Broadcom Despite Market Volatility
Saving...
High Volume Trading Suggests Institutional Accumulation
Saving...
Technical Analysis Points to Strong Short-term Trading Setup
Saving...
Risk Management Critical Amid Increased Volatility
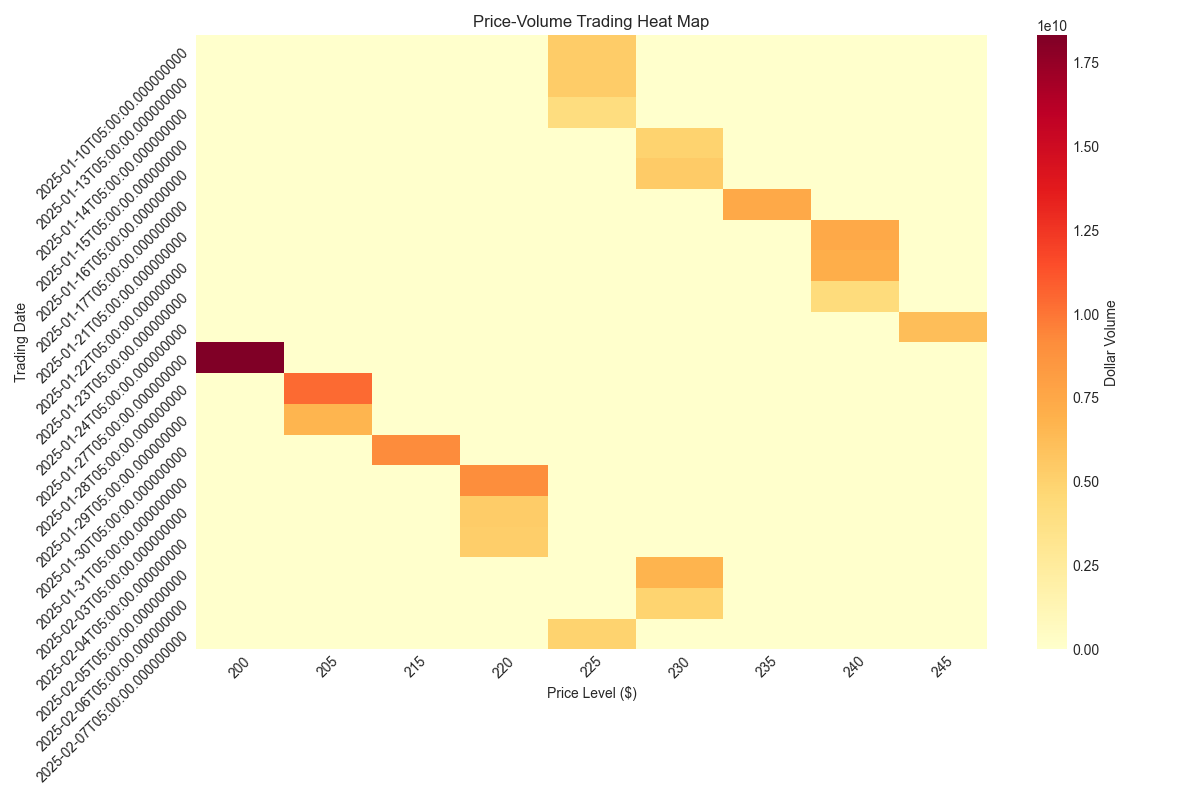
Volume Analysis and Trading Activity
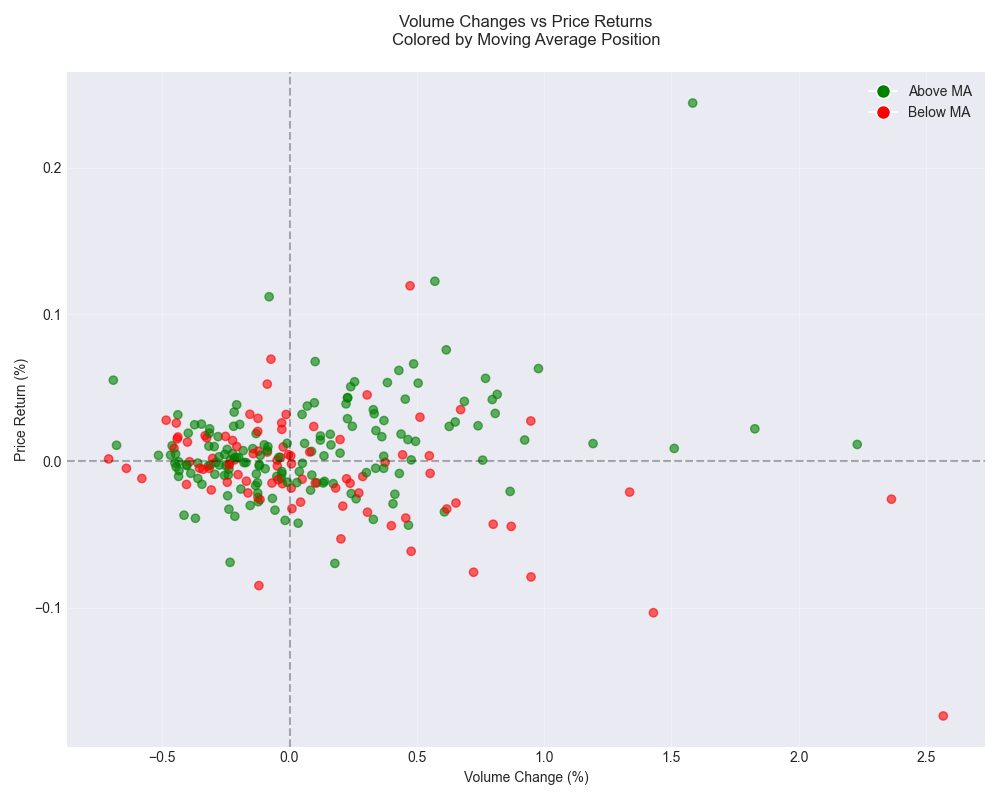
![Scatter plot showing the relationship between volume changes and price returns, with green points indicating prices above the moving average and red points below. Scatter plot showing the relationship between volume changes and price returns, with green points indicating prices above the moving average and red points below.](/assets/analysis/c08e2492-e13c-42a9-bda4-9e043ca2915f//664a1327-73be-434d-bc9e-5b9759750e1a.png)
Technical Analysis and Support/Resistance Levels for Broadcom
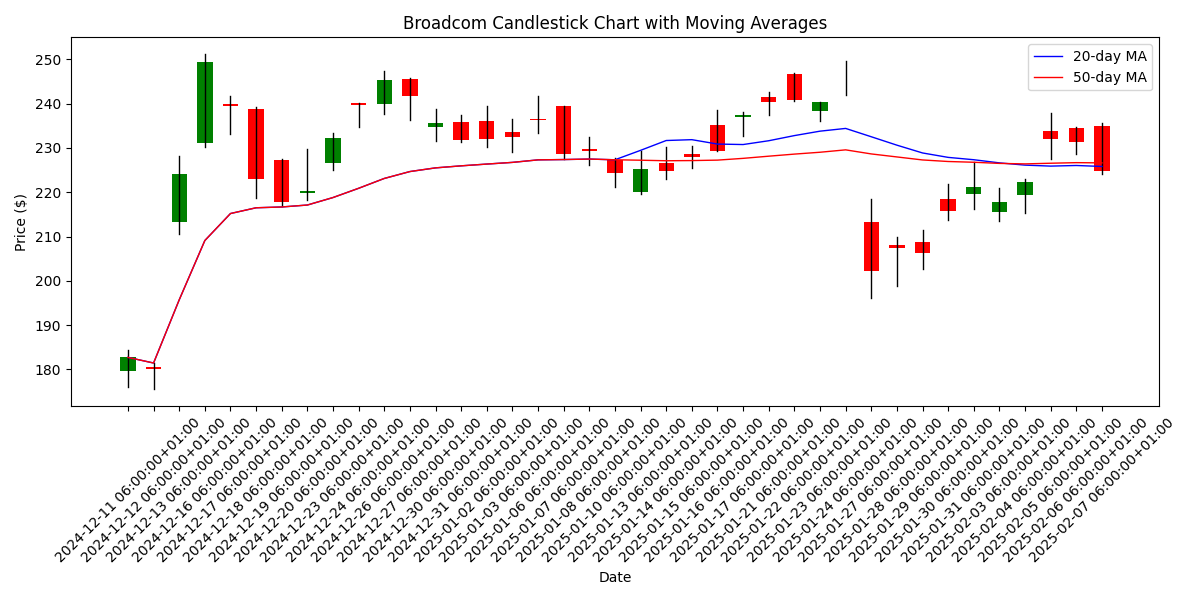
![Broadcom candlestick chart showing price action with 20-day and 50-day moving averages Broadcom candlestick chart showing price action with 20-day and 50-day moving averages](/assets/analysis/c08e2492-e13c-42a9-bda4-9e043ca2915f//b0026066-45c1-4017-b7d7-c8eefafa471c.png)
Unusual Trading Patterns and Market Behavior Analysis
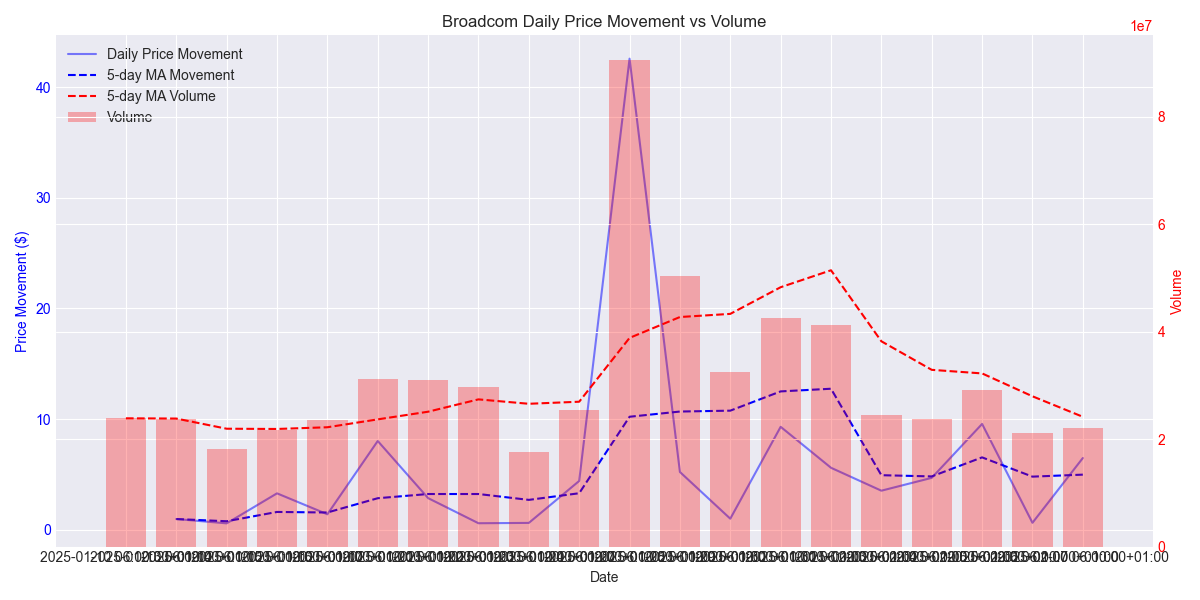
![Daily price movement versus volume with 5-day moving averages showing trading patterns Daily price movement versus volume with 5-day moving averages showing trading patterns](/assets/analysis/c08e2492-e13c-42a9-bda4-9e043ca2915f//f3e46c77-554c-43a1-b540-adc257372365.png)
Broadcom Stock Price Analysis and Short-term Predictions
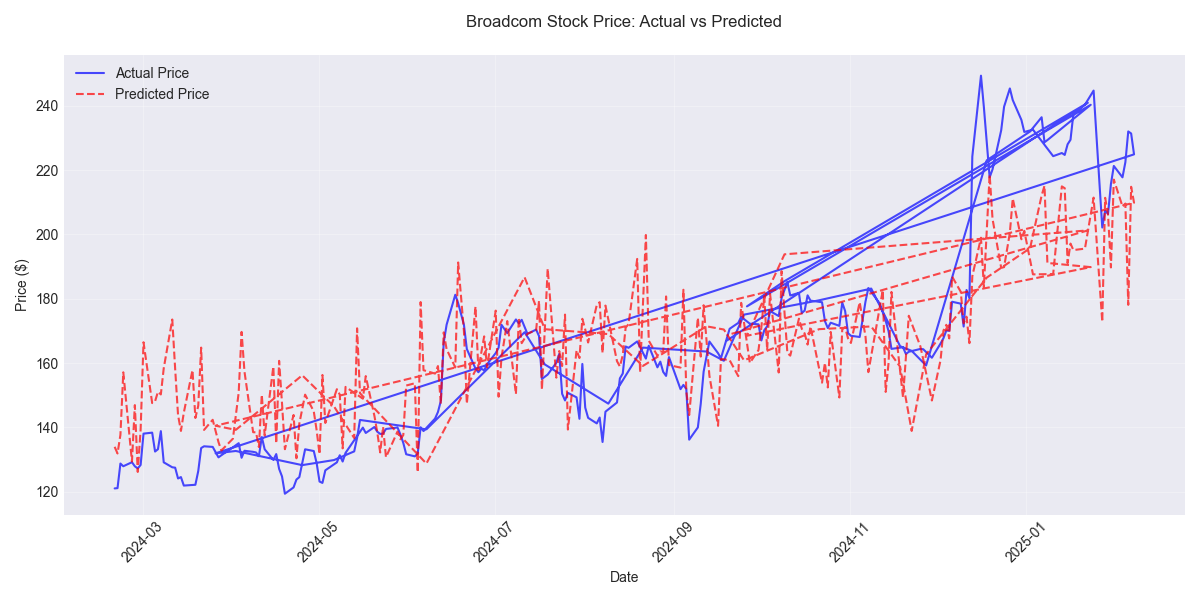
![Comparison of actual Broadcom stock prices against model predictions over time, showing the model's ability to track price movements. Comparison of actual Broadcom stock prices against model predictions over time, showing the model's ability to track price movements.](/assets/analysis/c08e2492-e13c-42a9-bda4-9e043ca2915f//1ecea51a-d52e-4544-ada7-5c4e117bf43e.png)
Key Technical Indicators and Risk Factors
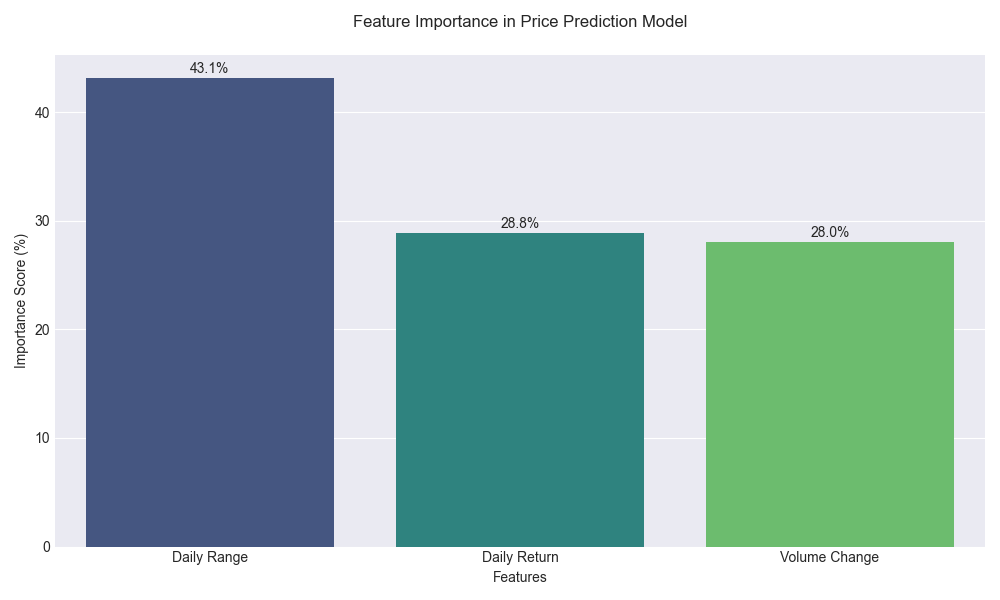
![Feature importance analysis showing the relative impact of technical indicators on price predictions. Feature importance analysis showing the relative impact of technical indicators on price predictions.](/assets/analysis/c08e2492-e13c-42a9-bda4-9e043ca2915f//2ecd4ebb-b028-48e5-b408-ebbe1e7b4ccc.png)
Trading Recommendations and Risk Assessment
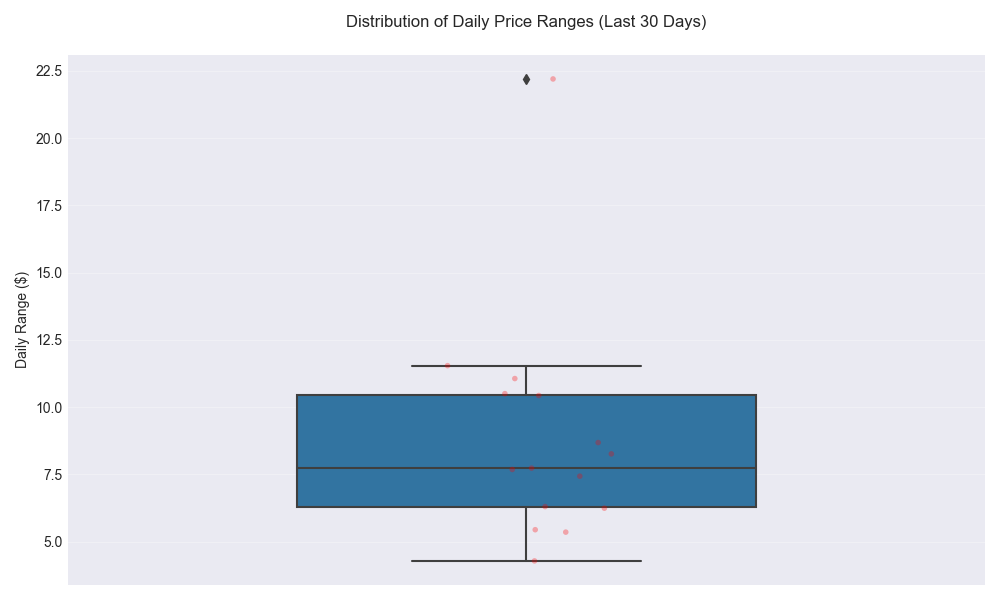
![Distribution of daily price ranges showing the current volatility levels and trading ranges for Broadcom stock. Distribution of daily price ranges showing the current volatility levels and trading ranges for Broadcom stock.](/assets/analysis/c08e2492-e13c-42a9-bda4-9e043ca2915f//d2b6780c-b478-45e4-afff-7b320817d967.png)
Short-term Price Projections and Confidence Analysis
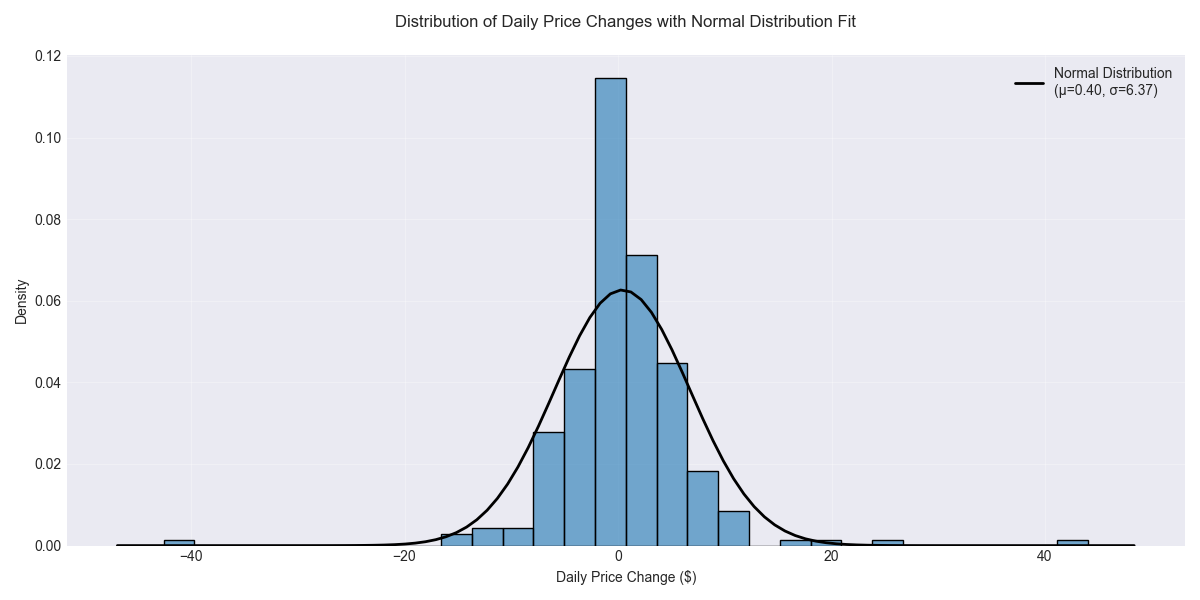
![Distribution of daily price changes showing the probability of different price movements and their comparison to a normal distribution. Distribution of daily price changes showing the probability of different price movements and their comparison to a normal distribution.](/assets/analysis/c08e2492-e13c-42a9-bda4-9e043ca2915f//2939b9e1-dda5-4b0a-a9eb-d48feef4bba3.png)
Technical Level Analysis and Trading Implications
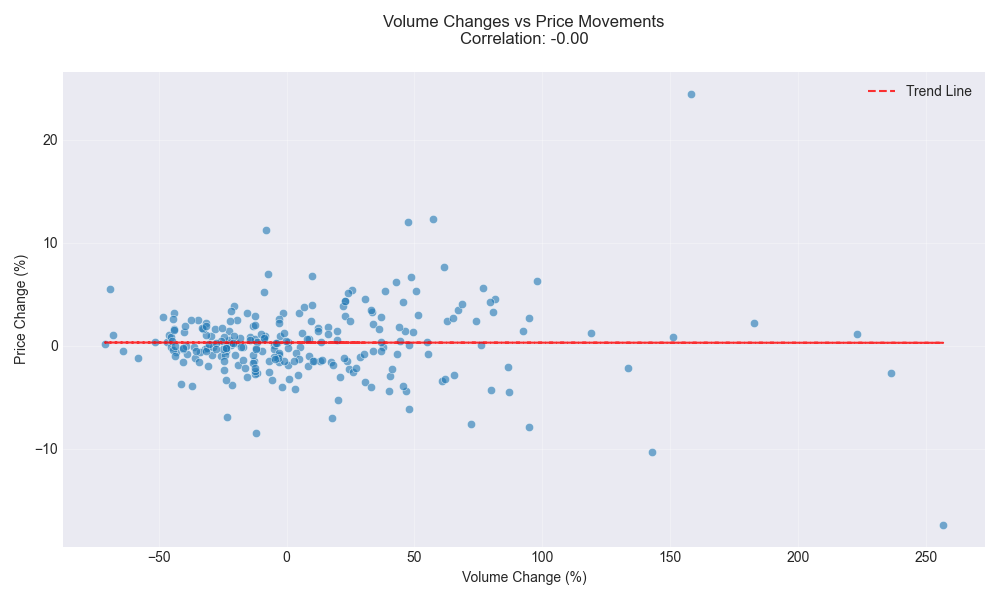
![Relationship between volume changes and price movements showing their correlation and trend. Relationship between volume changes and price movements showing their correlation and trend.](/assets/analysis/c08e2492-e13c-42a9-bda4-9e043ca2915f//3c210159-62c1-4927-af10-4e30290881fa.png)
Volatility Analysis and Risk Assessment
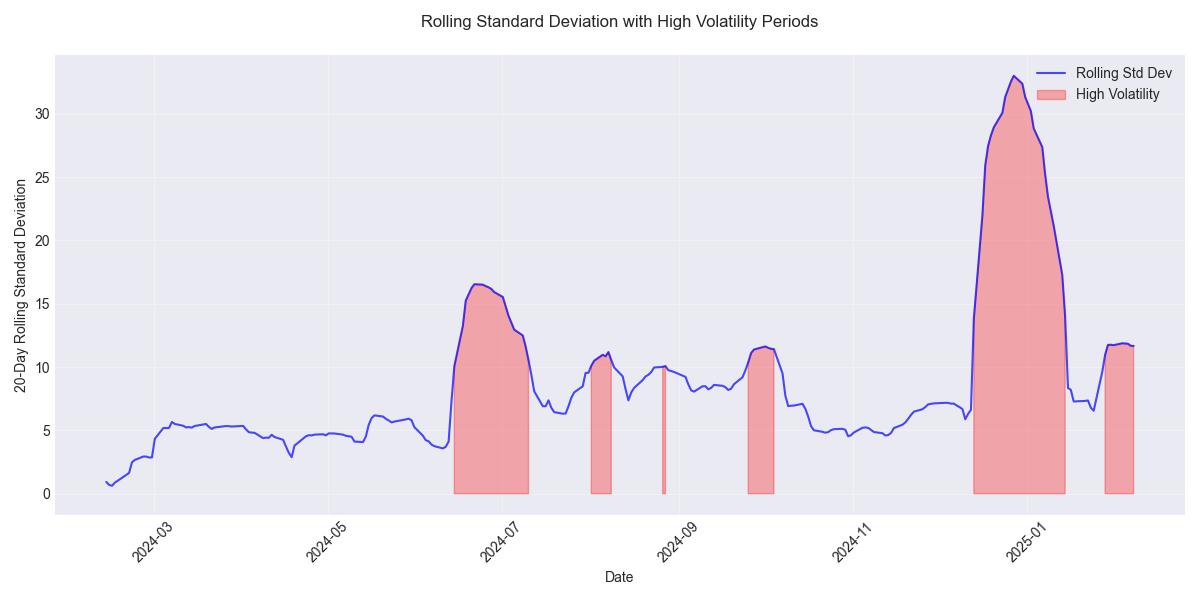
![20-day rolling standard deviation of Broadcom stock price with highlighted periods of high volatility (above 75th percentile). 20-day rolling standard deviation of Broadcom stock price with highlighted periods of high volatility (above 75th percentile).](/assets/analysis/c08e2492-e13c-42a9-bda4-9e043ca2915f//510c13cd-cd60-4a74-9ef0-75a89db95428.png)
Price Movement Probability Analysis
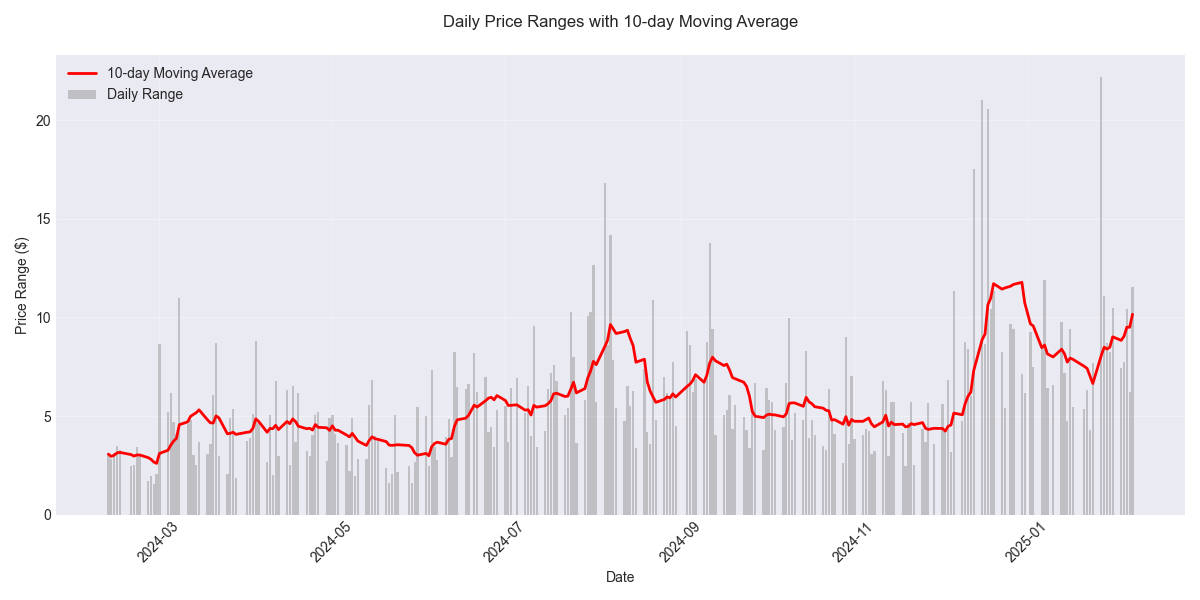
![Daily price ranges showing the volatility trend with a 10-day moving average overlay to highlight the trend in market volatility. Daily price ranges showing the volatility trend with a 10-day moving average overlay to highlight the trend in market volatility.](/assets/analysis/c08e2492-e13c-42a9-bda4-9e043ca2915f//41e7d539-731d-4206-bedd-a768b8613141.png)
Technical Analysis and Price Momentum Indicators
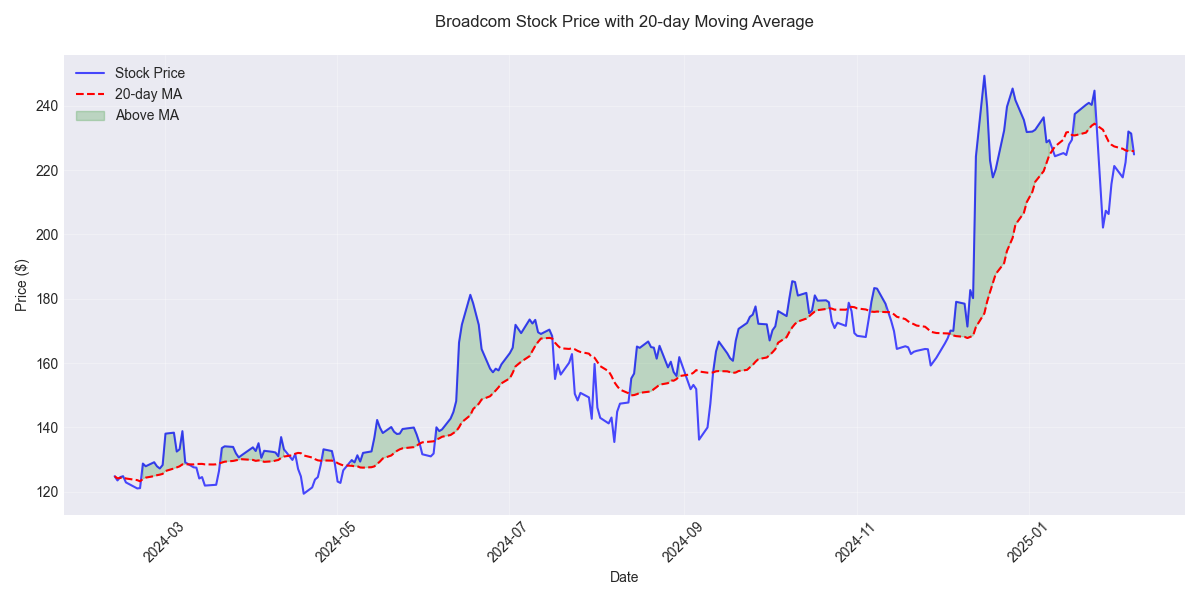
![Stock price trend with 20-day moving average overlay, highlighting periods when price is trading above the moving average indicating bullish momentum. Stock price trend with 20-day moving average overlay, highlighting periods when price is trading above the moving average indicating bullish momentum.](/assets/analysis/c08e2492-e13c-42a9-bda4-9e043ca2915f//1f9467ca-41f1-4e93-a8c1-6d698246182d.png)
Broadcom Stock Analysis: Recent Price Action and Market Sentiment
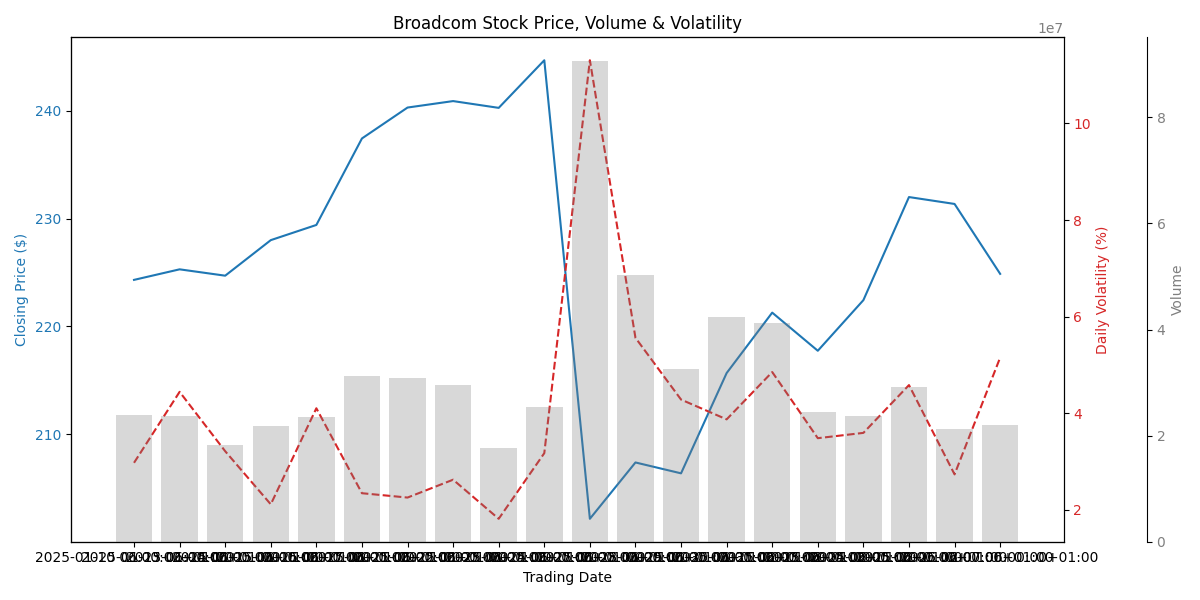
![Broadcom's stock price movement with daily volatility and trading volume over the past month Broadcom's stock price movement with daily volatility and trading volume over the past month](/assets/analysis/c08e2492-e13c-42a9-bda4-9e043ca2915f//b872c12c-406b-478a-a49a-79a05eecff19.png)