VIX Market Volatility Analysis and Trading Recommendations
VIX at Critical Support: Volatility Surge Warning
Market Fear Index Shows Strong Confidence
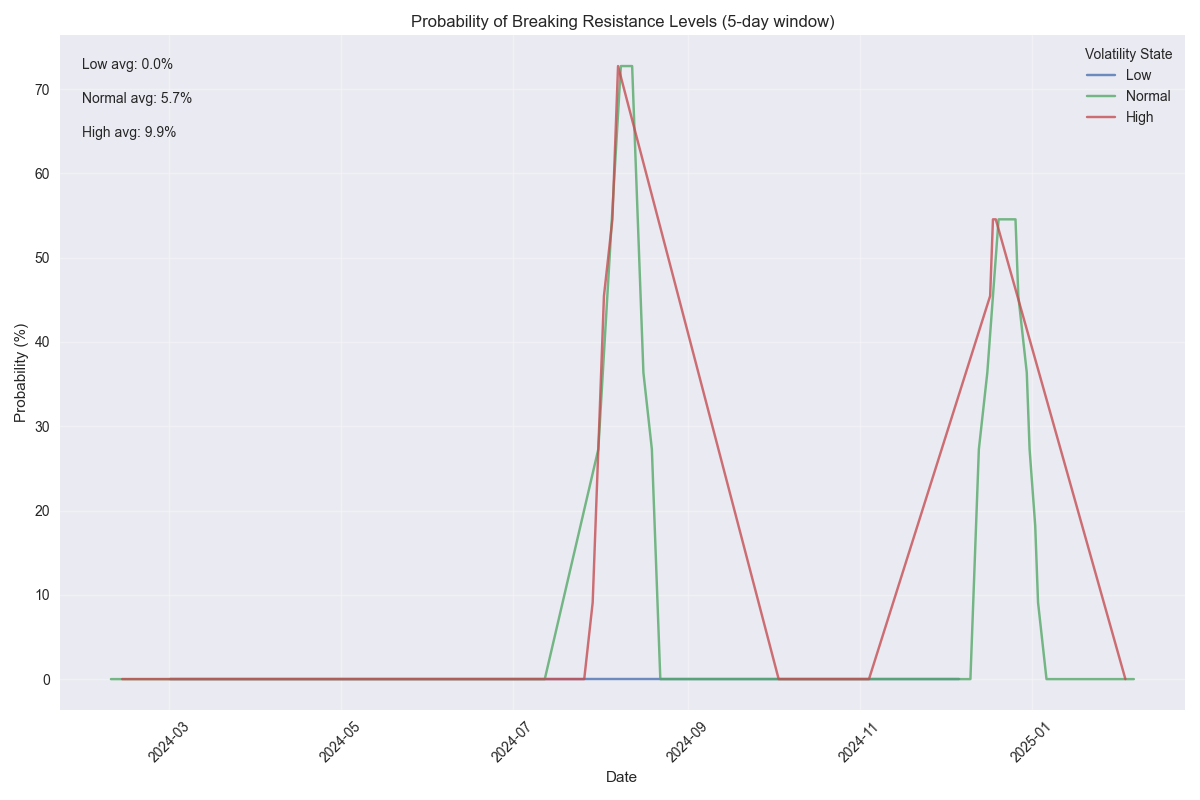
Key Trading Levels and Break Probabilities
VIX Support/Resistance Level Analysis and Break Probabilities
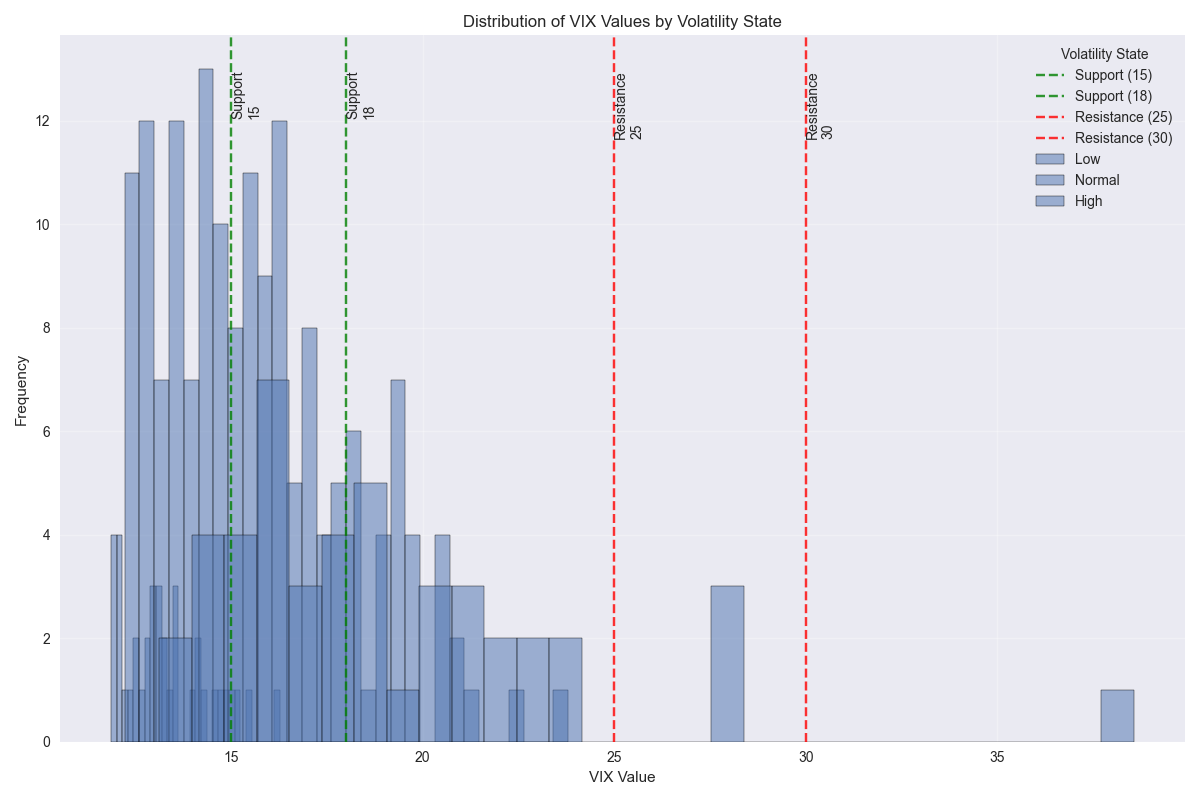
![Histogram showing the distribution of VIX values across different volatility states with key support levels (15, 18) and resistance levels (25, 30) marked. Histogram showing the distribution of VIX values across different volatility states with key support levels (15, 18) and resistance levels (25, 30) marked.](/assets/analysis/38dfc7e4-a304-43cd-8384-12aacd7e604d//7b725584-da52-4842-a258-e7db9d27d22d.png)
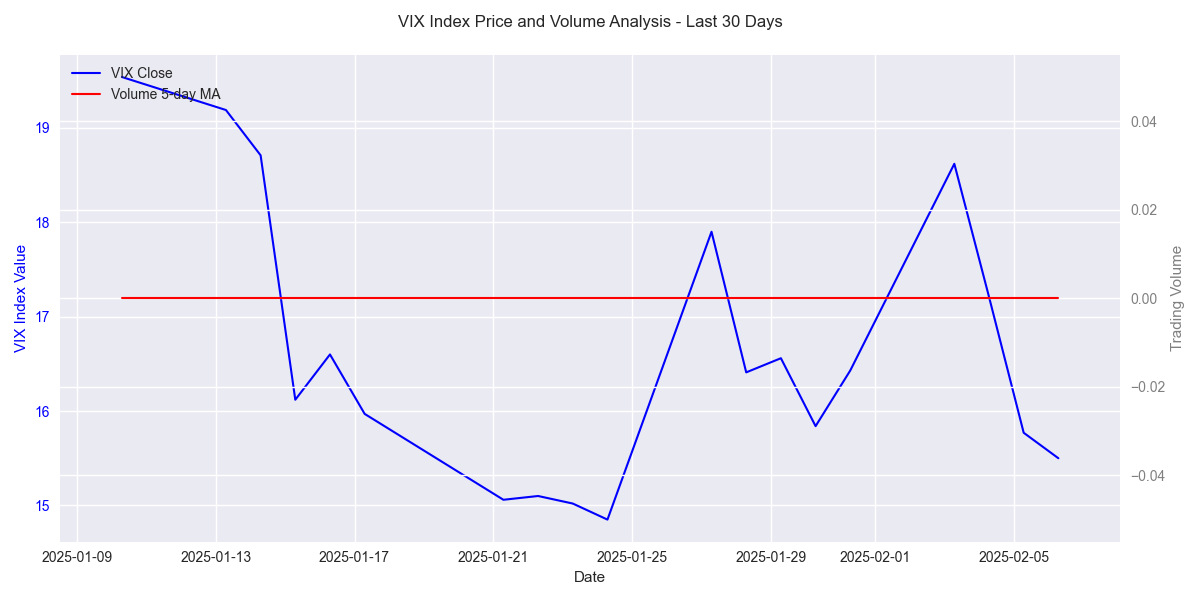
VIX Analysis Reveals Market Stability with Recent Downward Trend
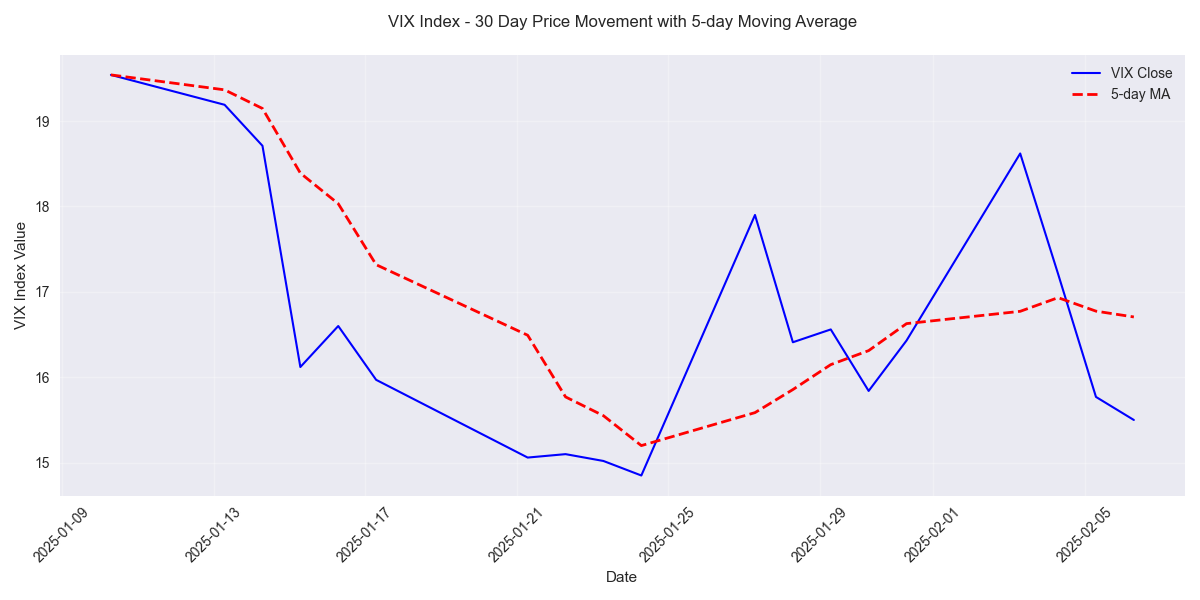
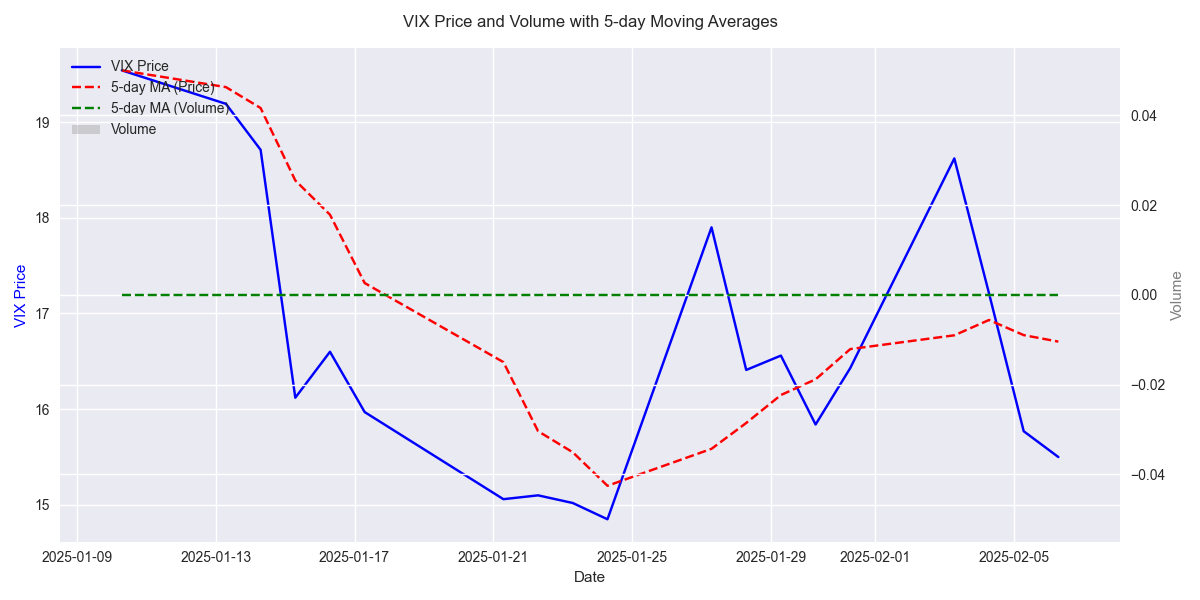
![VIX Index price movement over the last 30 days with 5-day moving average showing the recent downward trend. VIX Index price movement over the last 30 days with 5-day moving average showing the recent downward trend.](/assets/analysis/38dfc7e4-a304-43cd-8384-12aacd7e604d//8c3a8c5f-21bc-4ef6-8bf7-9e3d6325a855.png)
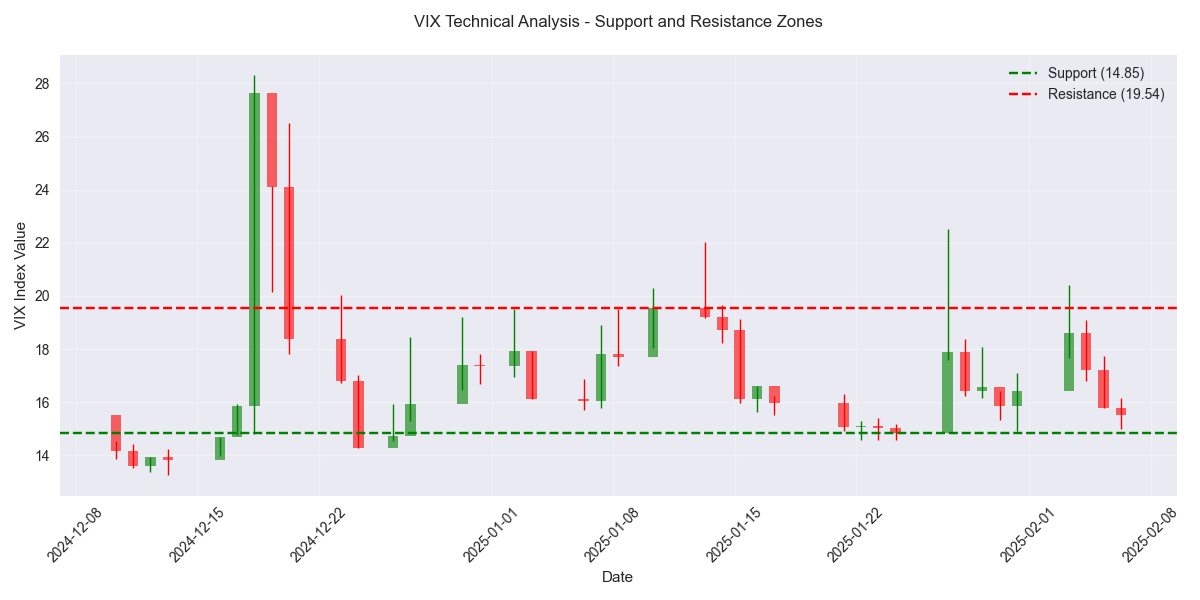
VIX Technical Analysis Reveals Key Trading Signals
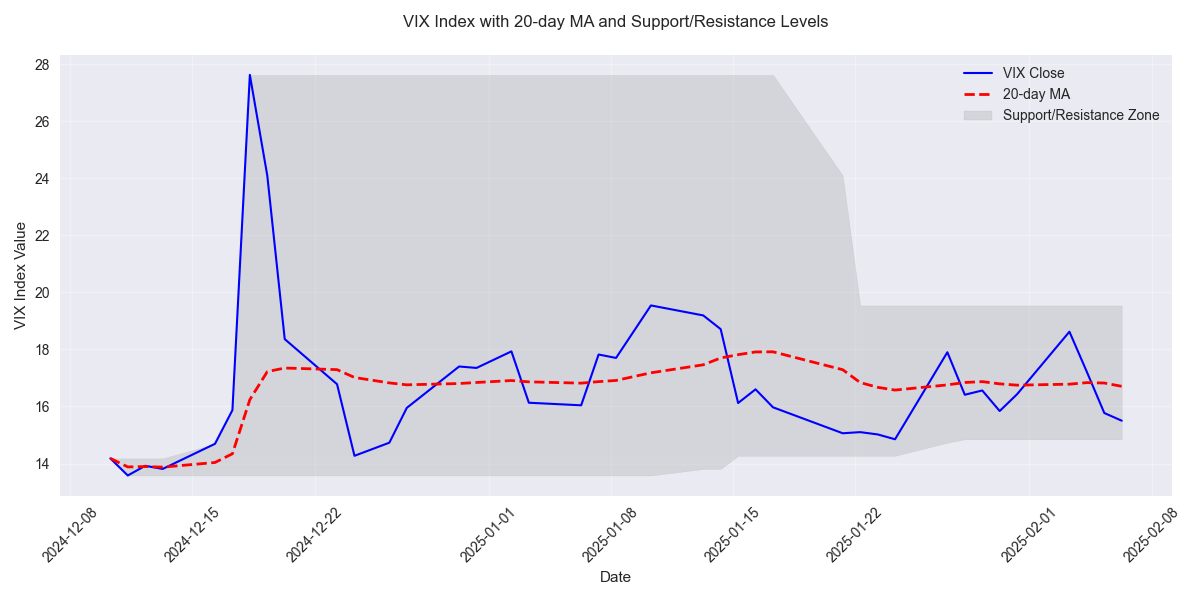
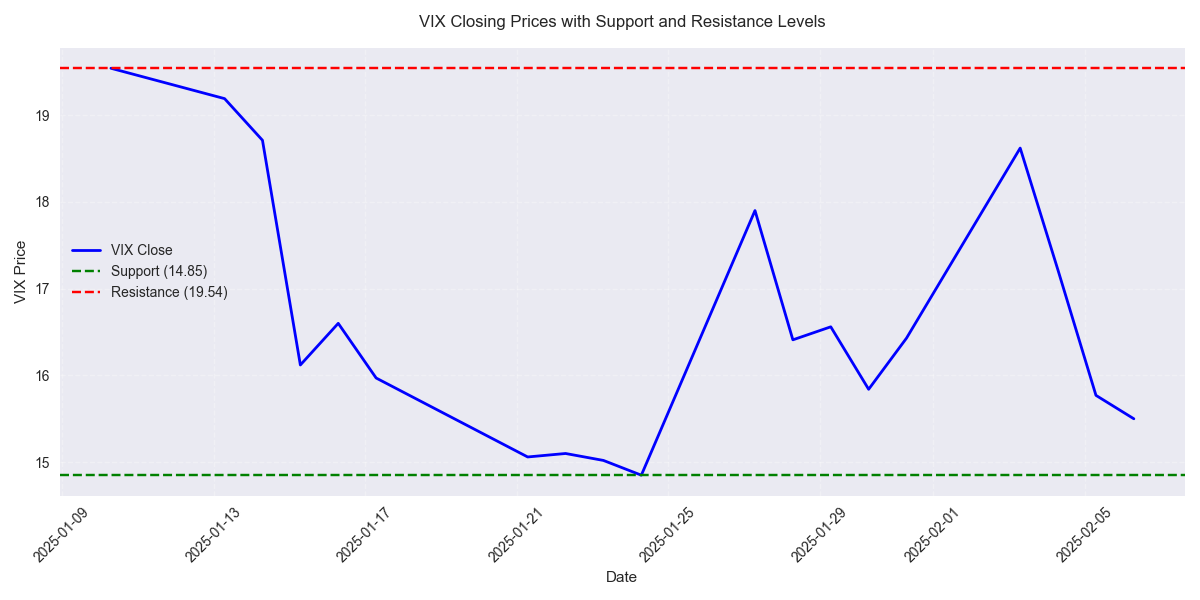
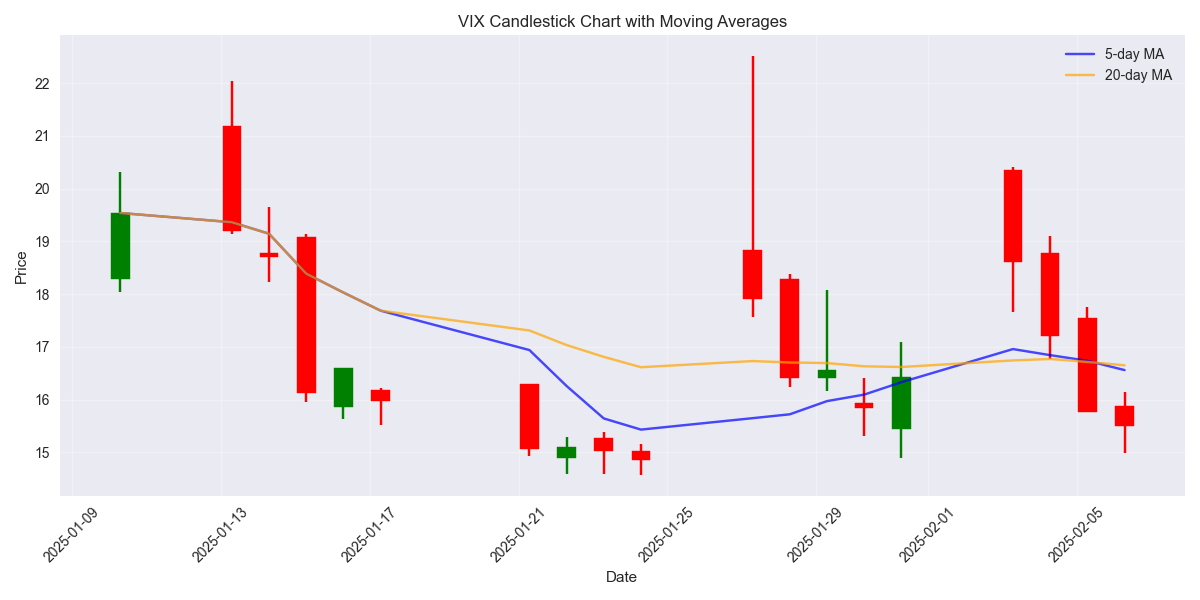
![VIX Index price movement with 20-day moving average and support/resistance levels showing the current trading range and trend. VIX Index price movement with 20-day moving average and support/resistance levels showing the current trading range and trend.](/assets/analysis/38dfc7e4-a304-43cd-8384-12aacd7e604d//d8ff8293-062c-4636-8288-bb69b1762cfe.png)
VIX and Market Correlation Analysis Reveals Strong Trading Signals
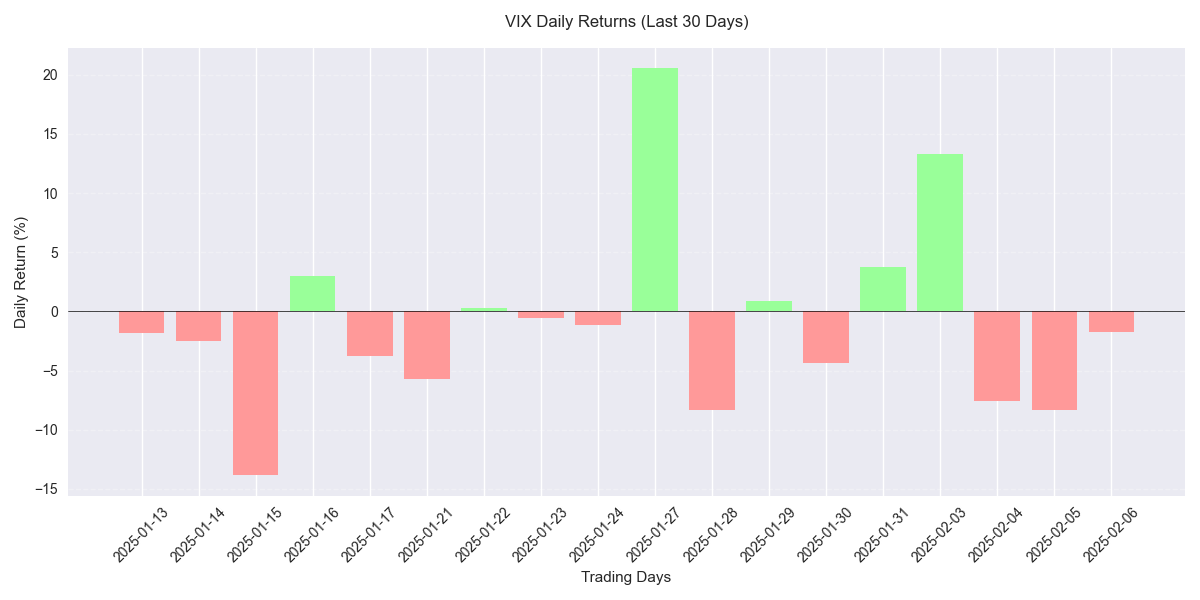
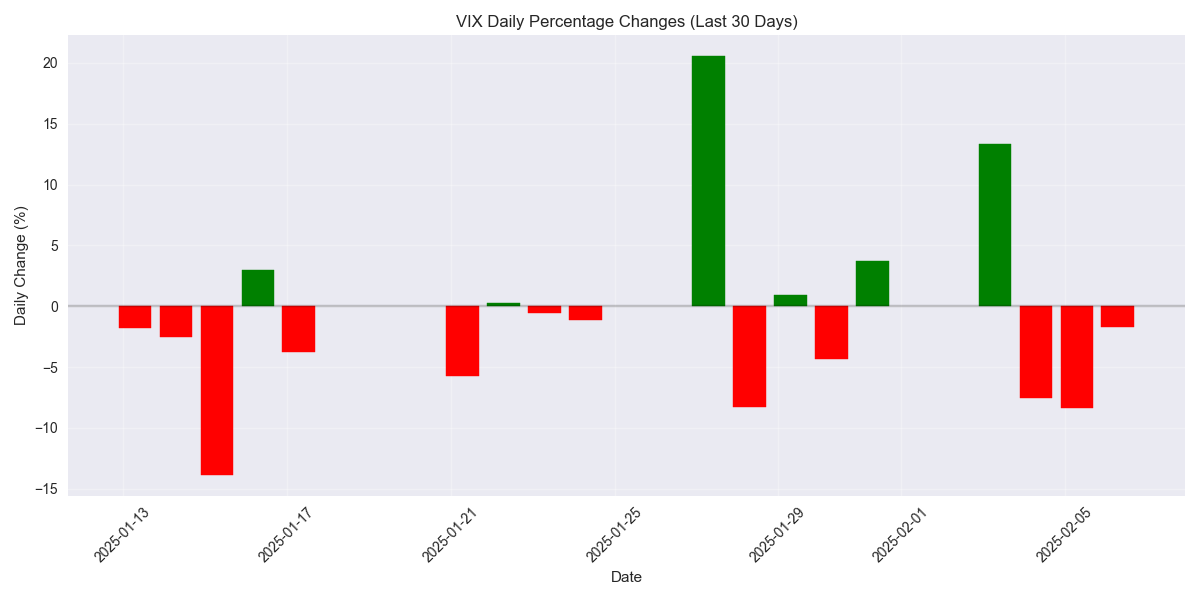
![VIX Daily Returns showing the distribution of positive (green) and negative (red) returns over the last 30 days VIX Daily Returns showing the distribution of positive (green) and negative (red) returns over the last 30 days](/assets/analysis/38dfc7e4-a304-43cd-8384-12aacd7e604d//0d516428-e3d2-4d03-9b2f-71b74d2daf3f.png)
VIX Index Short-Term Price Prediction Analysis
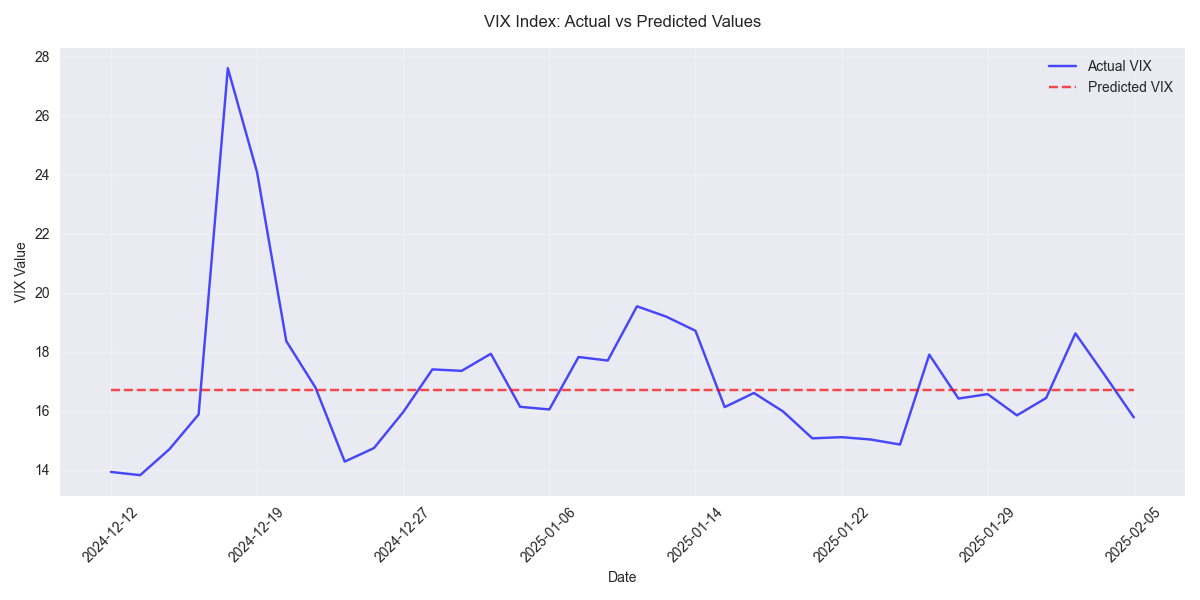
![Comparison of actual VIX Index values versus model predictions over time, showing the model's ability to track market volatility trends. Comparison of actual VIX Index values versus model predictions over time, showing the model's ability to track market volatility trends.](/assets/analysis/38dfc7e4-a304-43cd-8384-12aacd7e604d//e595162e-ad12-4d5d-bba3-06c506665fed.png)
VIX Weekly Predictions and Volatility State Analysis
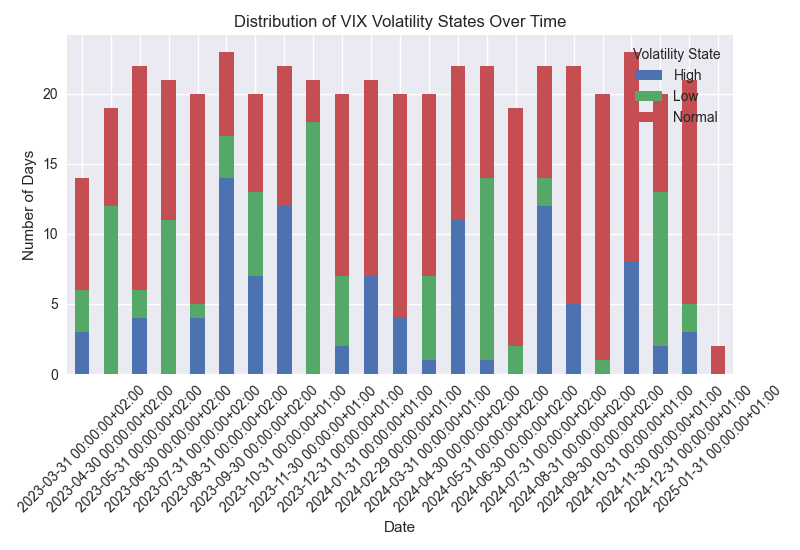
![Monthly distribution of VIX volatility states showing the frequency of High, Normal, and Low volatility periods over the past year. Monthly distribution of VIX volatility states showing the frequency of High, Normal, and Low volatility periods over the past year.](/assets/analysis/38dfc7e4-a304-43cd-8384-12aacd7e604d//d6ab93cc-a1d3-40f6-b230-eb022c3b15ac.png)
VIX Index Short-Term Prediction Analysis Reveals Strong Accuracy
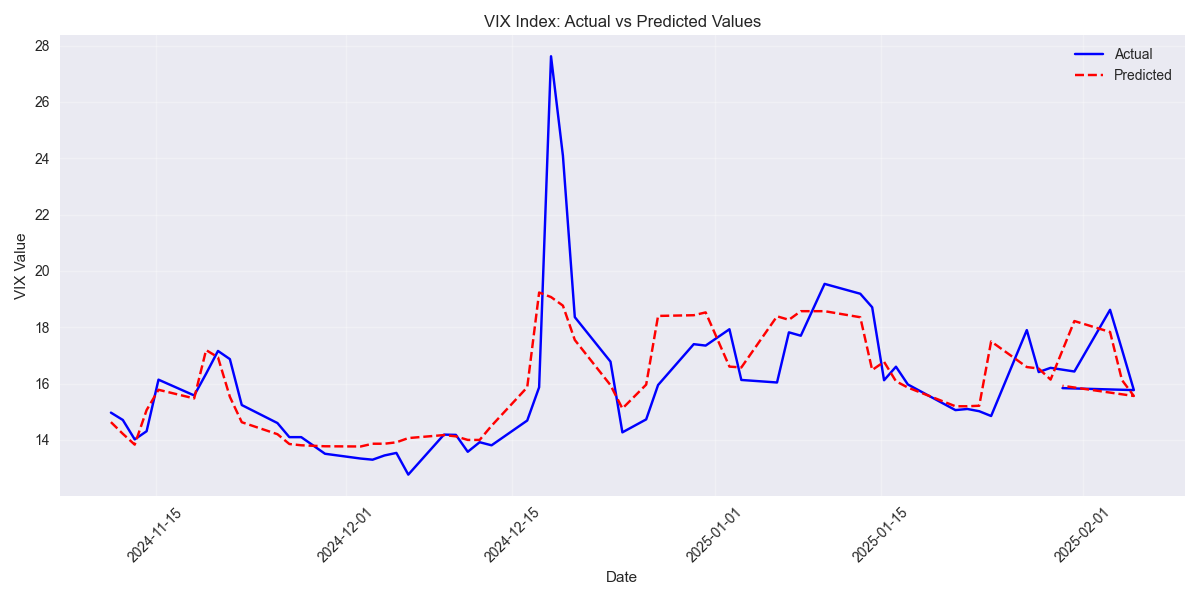
![Comparison of actual VIX values versus model predictions over time, showing the model's ability to track market movements. Comparison of actual VIX values versus model predictions over time, showing the model's ability to track market movements.](/assets/analysis/38dfc7e4-a304-43cd-8384-12aacd7e604d//ca4f9830-b5f8-4472-898f-13f9070f90bb.png)
VIX Monthly Predictions and Risk Factor Analysis
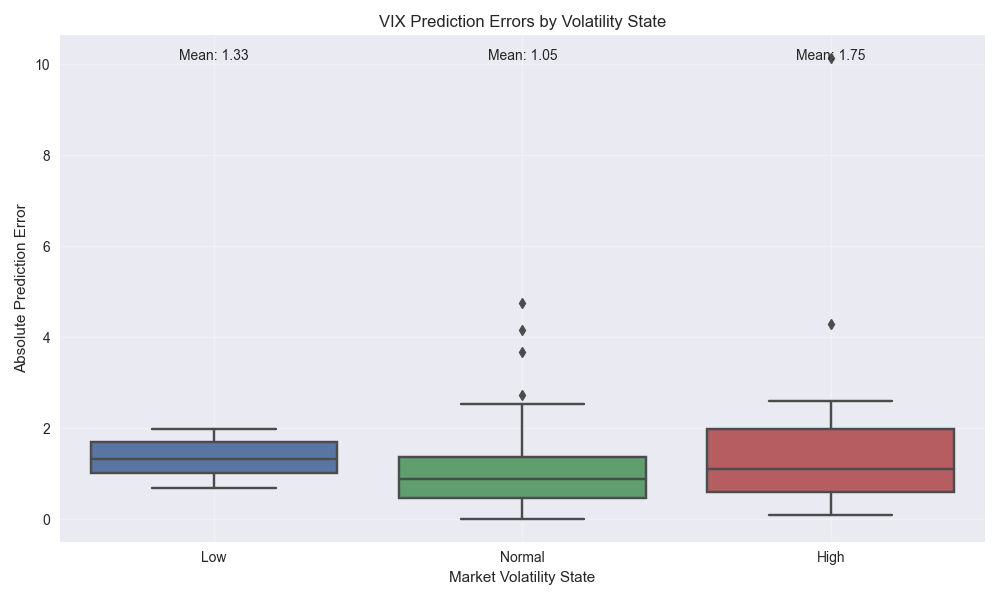
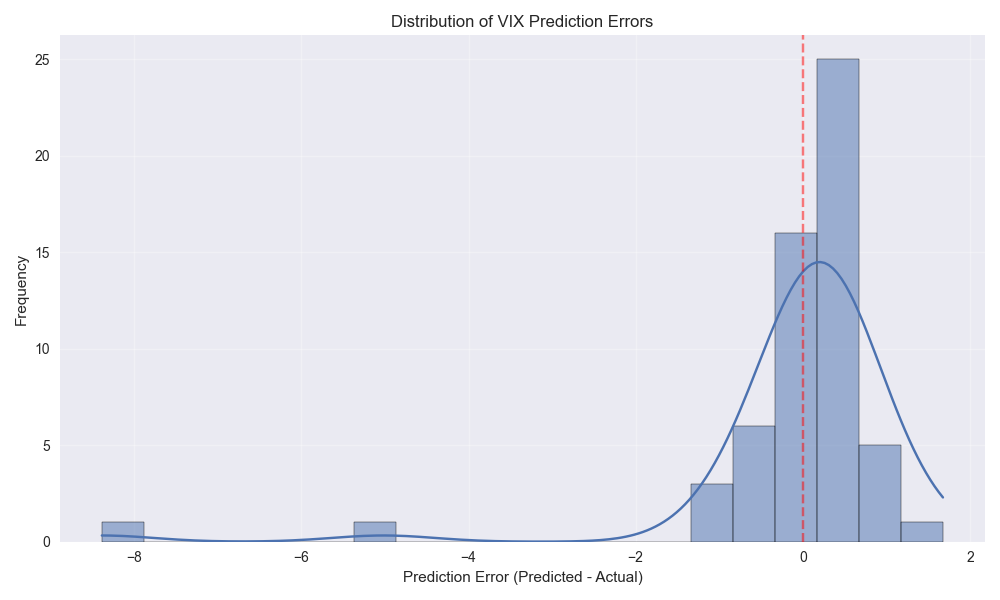
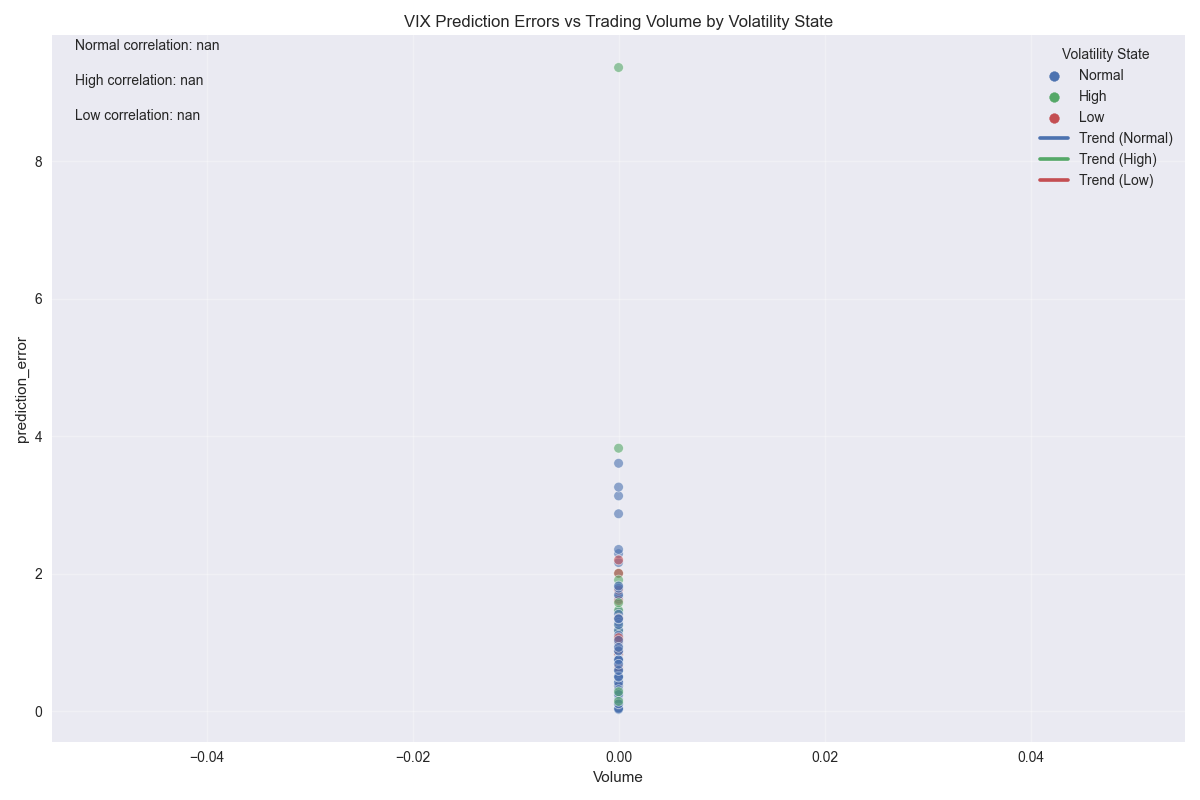
![Box plot showing the distribution of VIX prediction errors across different market volatility states (Low, Normal, High). Box plot showing the distribution of VIX prediction errors across different market volatility states (Low, Normal, High).](/assets/analysis/38dfc7e4-a304-43cd-8384-12aacd7e604d//6e768b1d-e997-4fa2-9bad-453868702cd7.png)
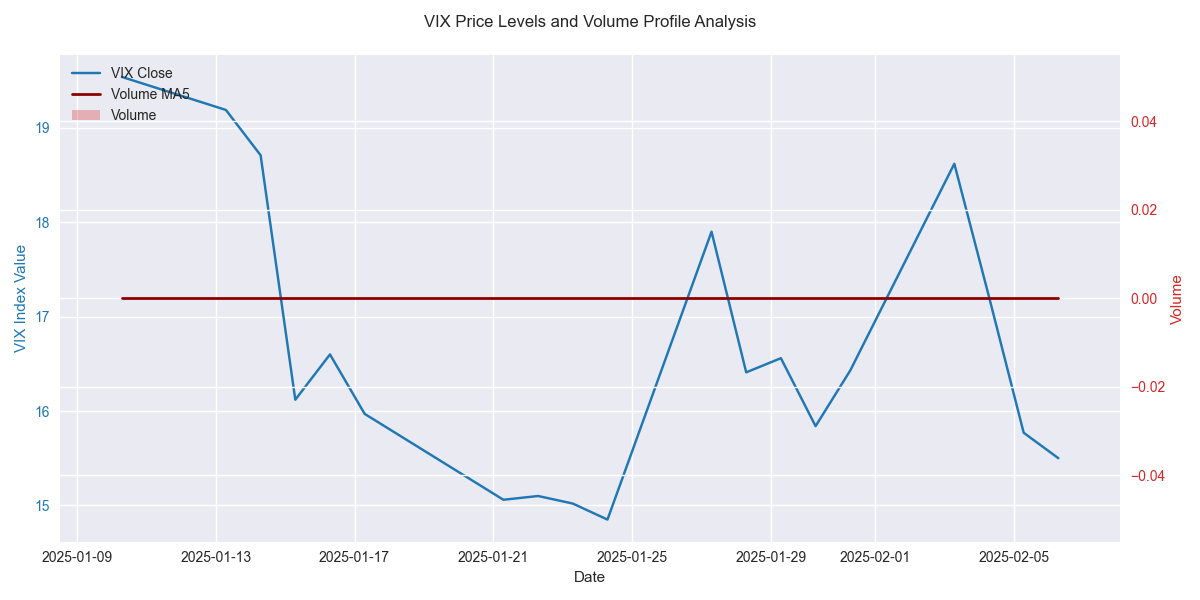
Recent VIX Price Movements Show Declining Volatility Trend
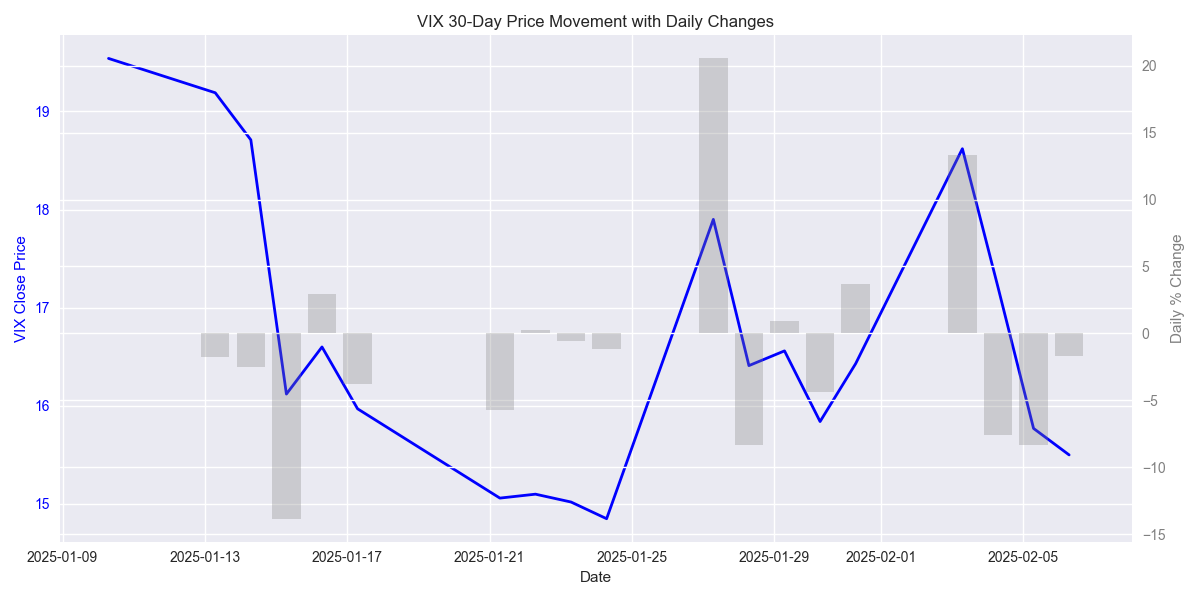
![VIX closing prices over the last 30 days with daily percentage changes shown as bars in the background. VIX closing prices over the last 30 days with daily percentage changes shown as bars in the background.](/assets/analysis/38dfc7e4-a304-43cd-8384-12aacd7e604d//03a0afbe-6fed-4e3f-acb7-0cd23869d84e.png)