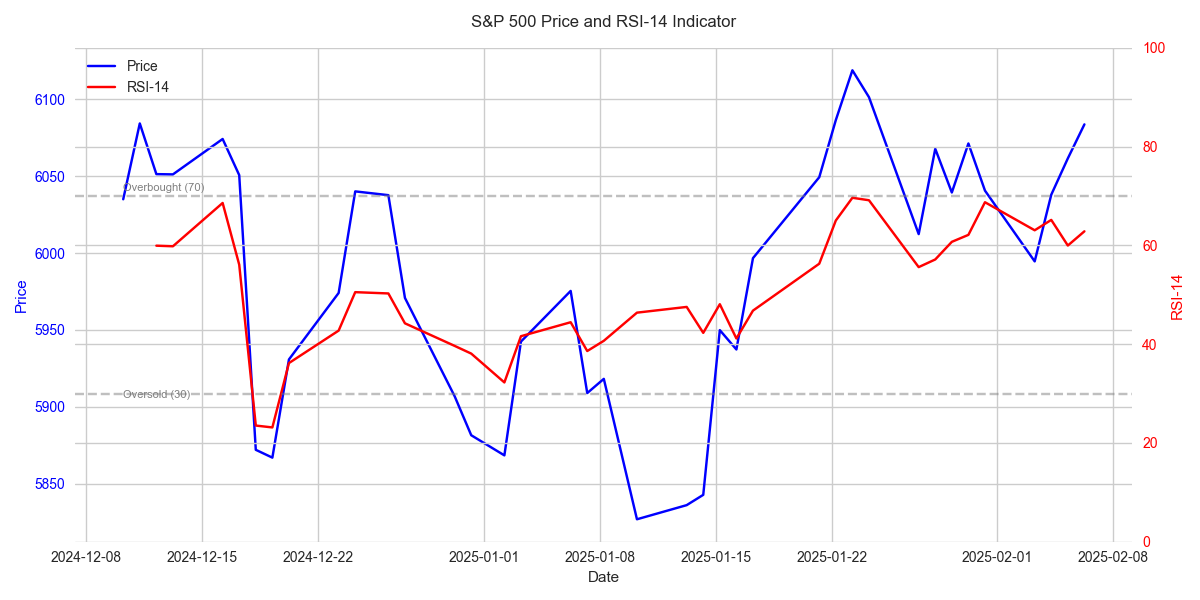
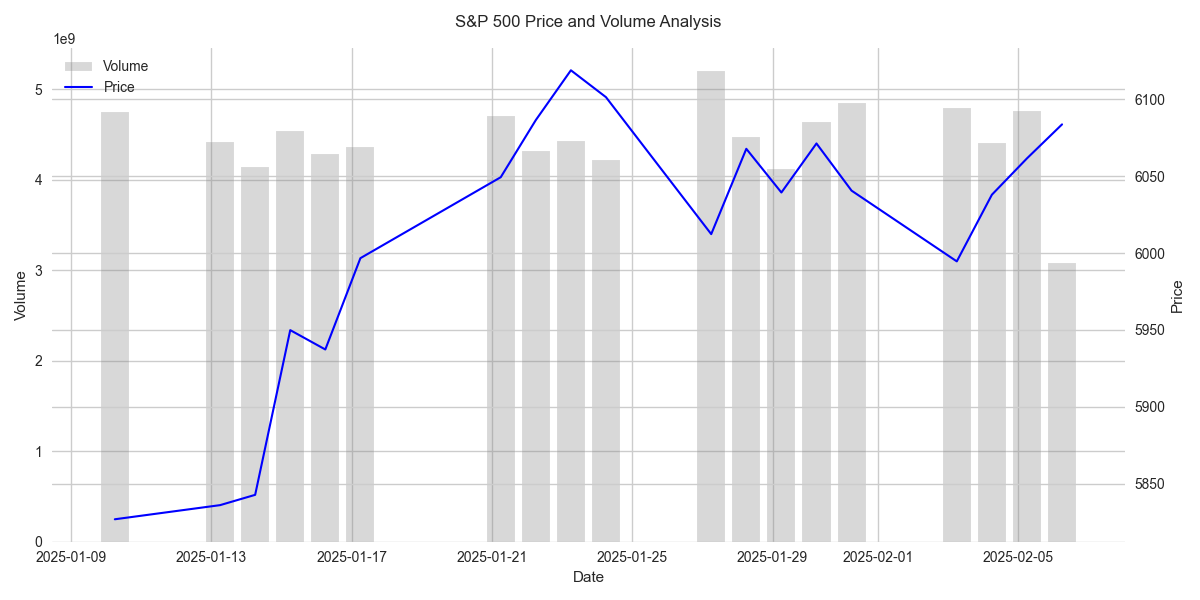
S&P 500 Market Insights: Quick Trader Briefing
S&P 500 Shows Strong Bullish Momentum Despite Volume Concerns
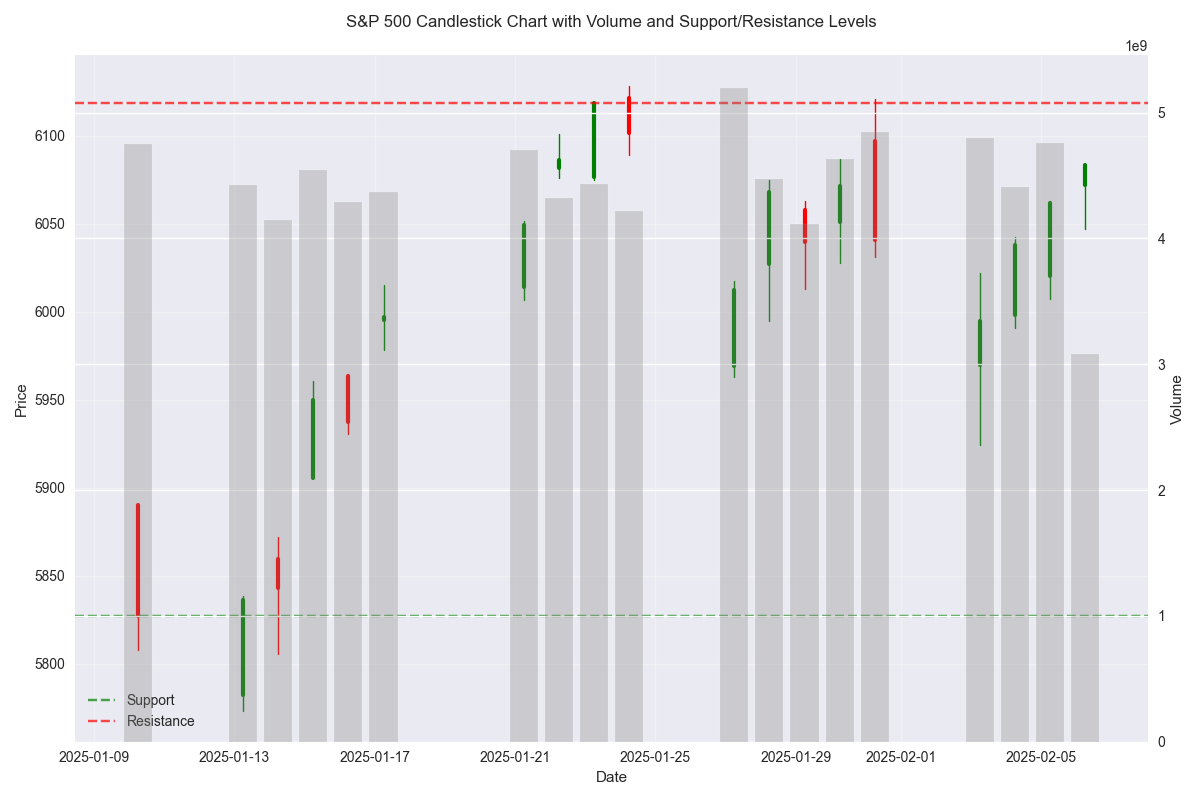
Critical Price Levels Set Stage for Potential Breakout
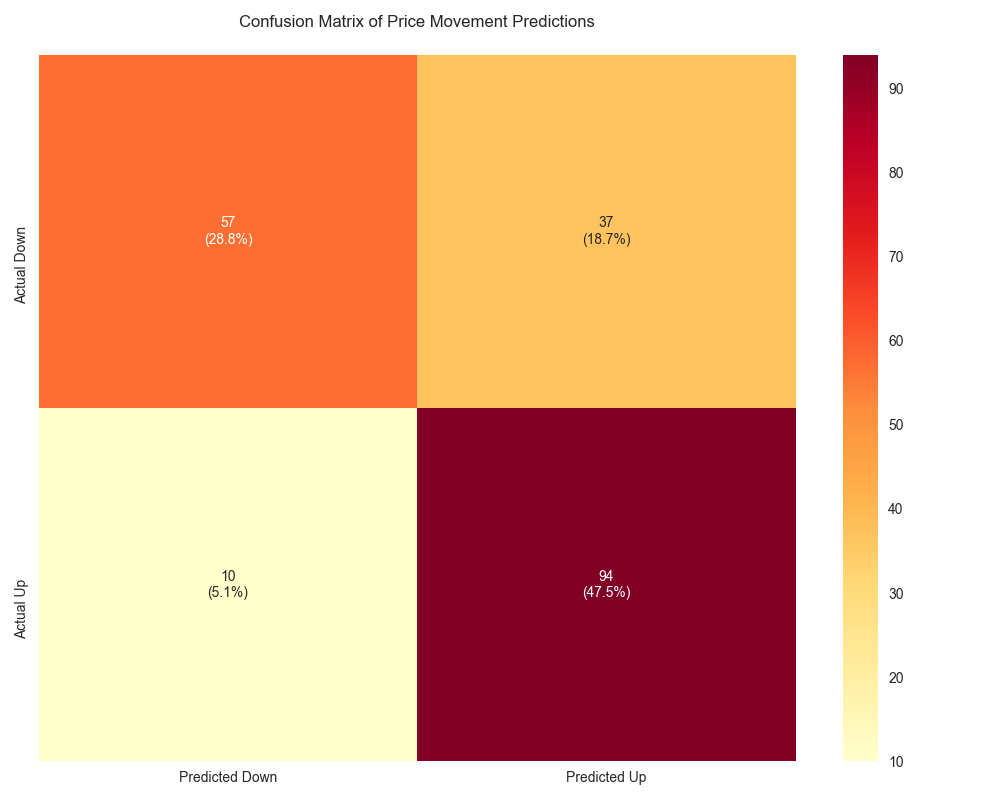
Trading Algorithm Shows Exceptional Accuracy for Buy Signals
Monthly Analysis Points to Strong Upward Bias
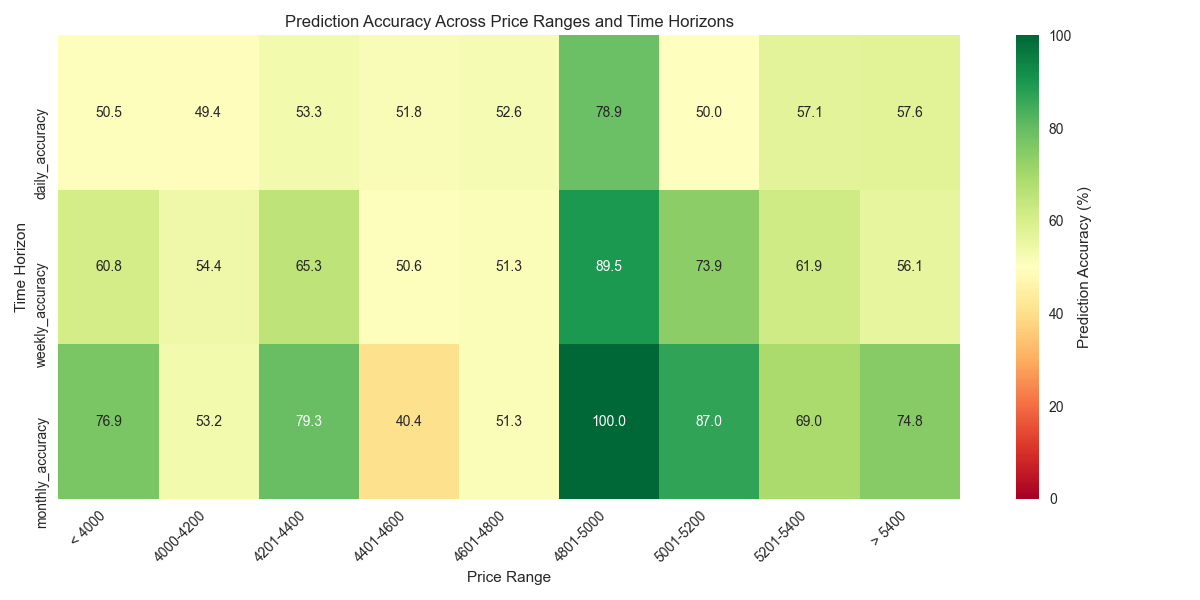
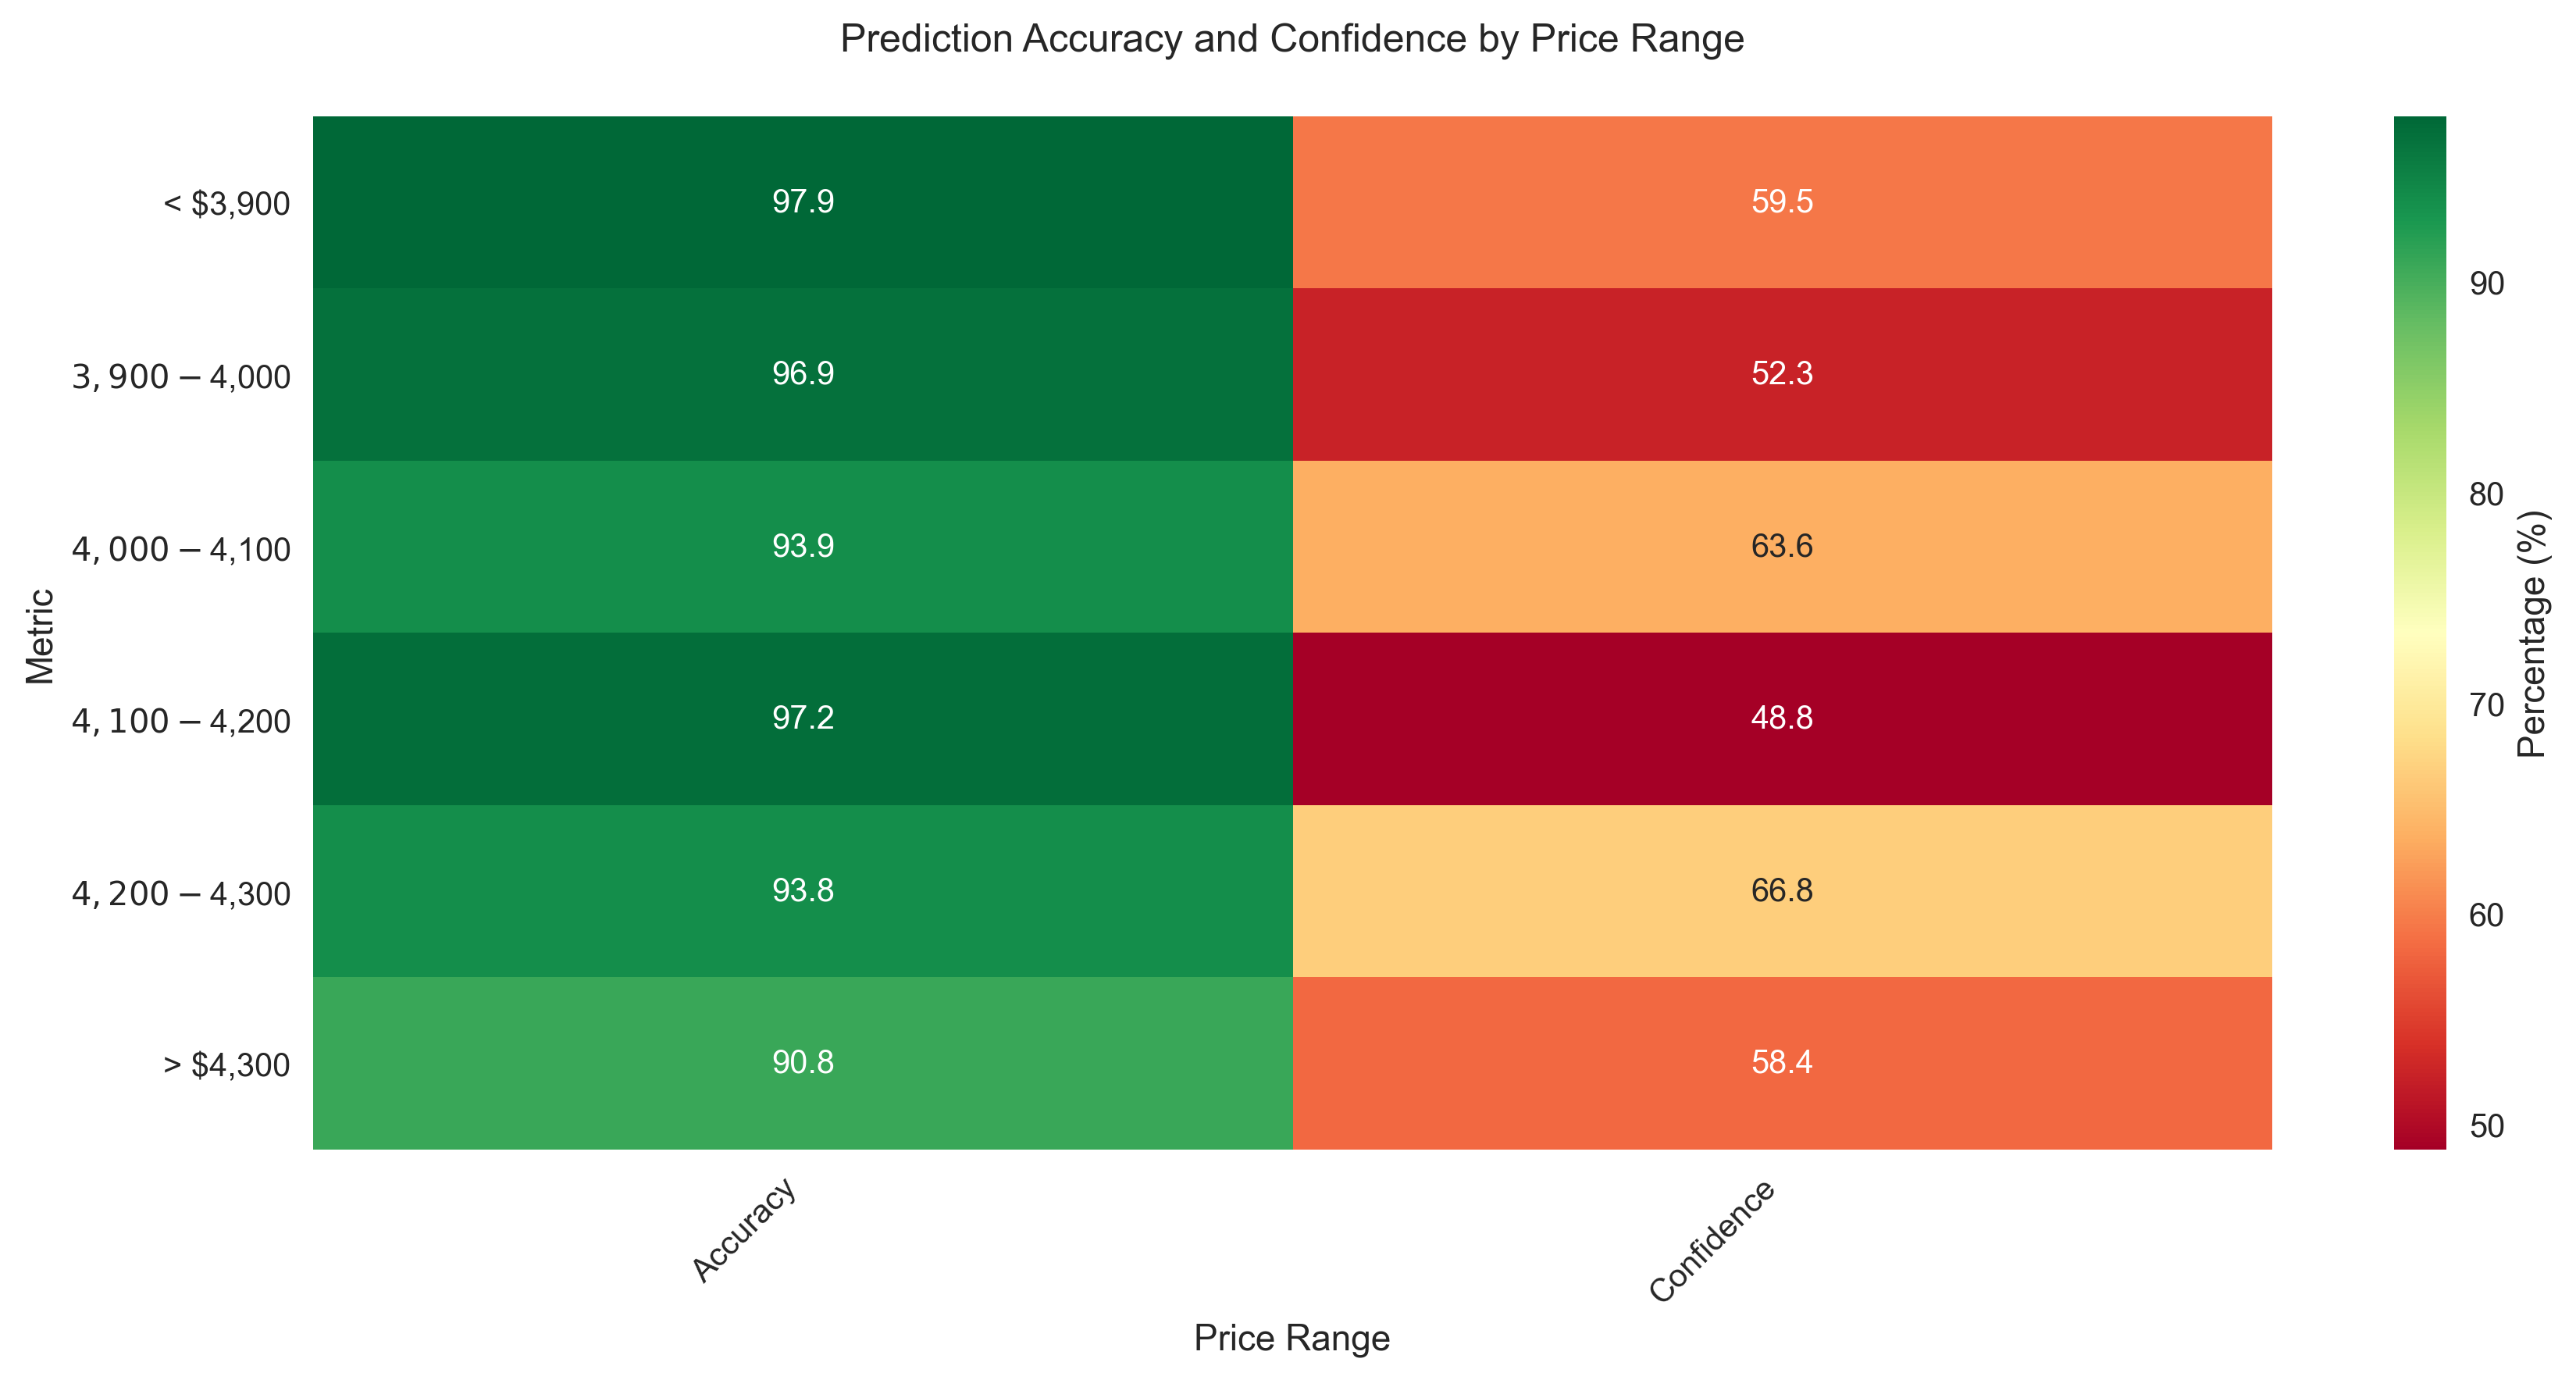
Optimal Trading Zones Identified with High Confidence
Comprehensive SP 500 Price Movement Analysis Across Multiple Time Horizons
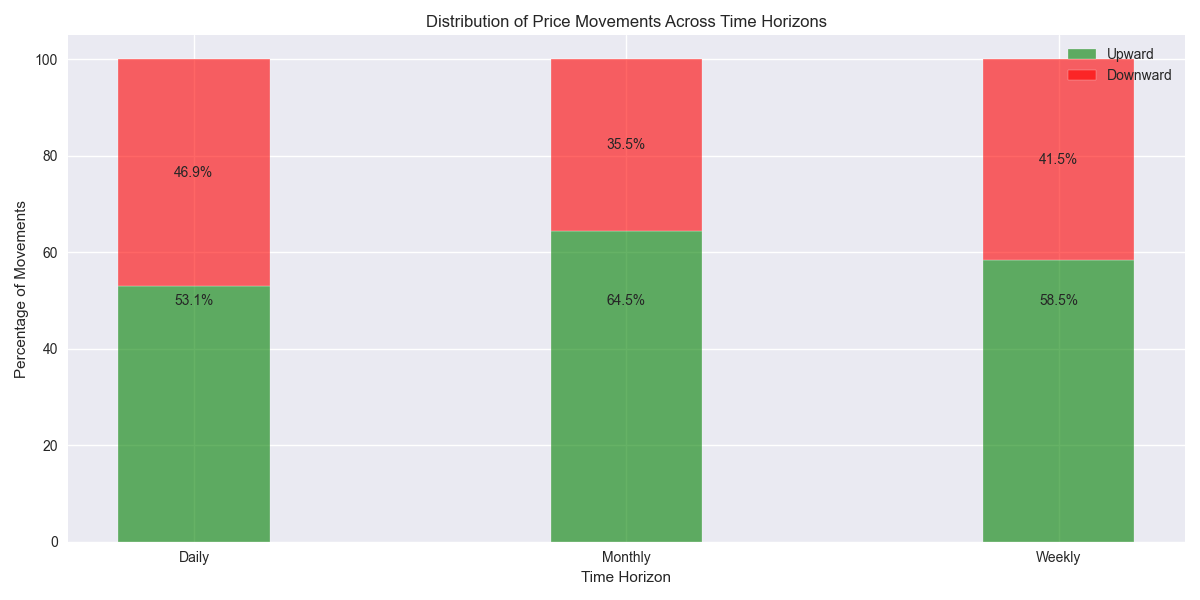
![Distribution of SP 500 price movements across different time horizons, showing increasing bullish bias in longer timeframes Distribution of SP 500 price movements across different time horizons, showing increasing bullish bias in longer timeframes](/assets/analysis/9f534c6e-4f30-4e09-8026-8aac963dfec7//70baf166-1499-4ec7-ac7e-a84eae155fe2.png)
S&P 500 Technical Support and Resistance Analysis Reveals Strong Bullish Position
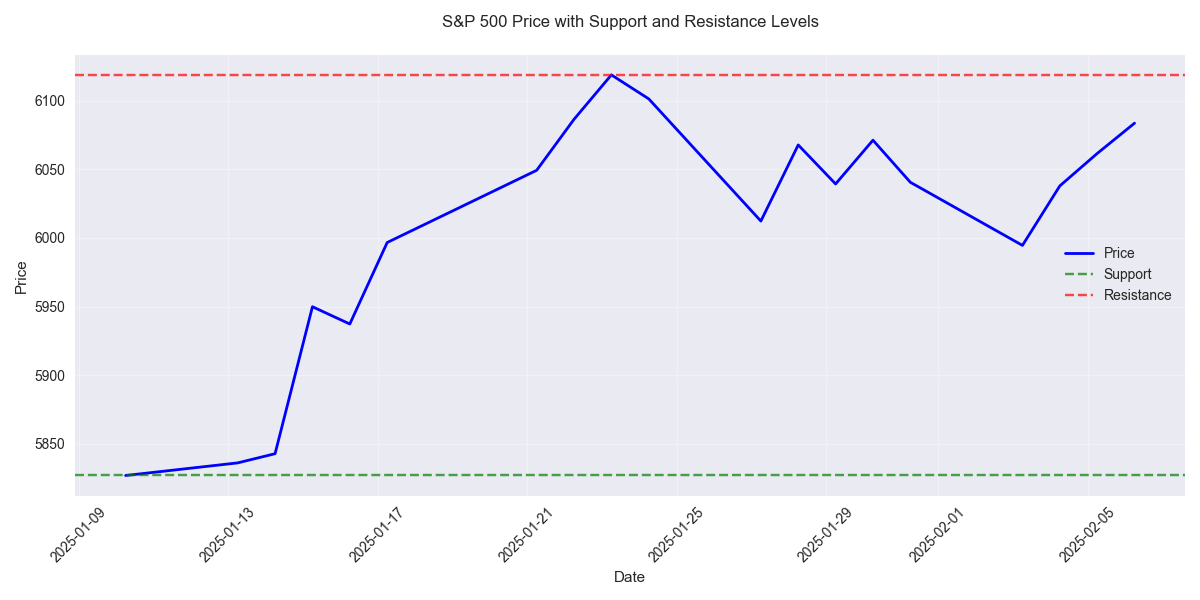
![S&P 500 price movement with key support and resistance levels marked as horizontal lines, showing the current trading range. S&P 500 price movement with key support and resistance levels marked as horizontal lines, showing the current trading range.](/assets/analysis/9f534c6e-4f30-4e09-8026-8aac963dfec7//45cb17d2-bf33-42ab-88e0-61b943f6648f.png)
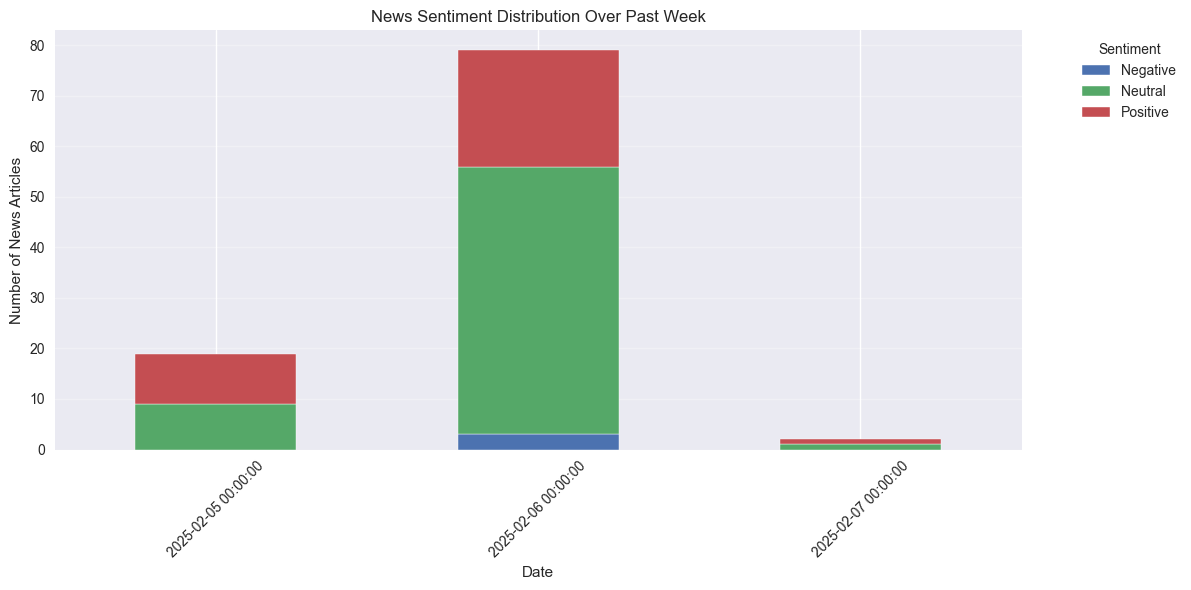
Market Sentiment Analysis Shows Mixed Signals Ahead of Key Economic Data
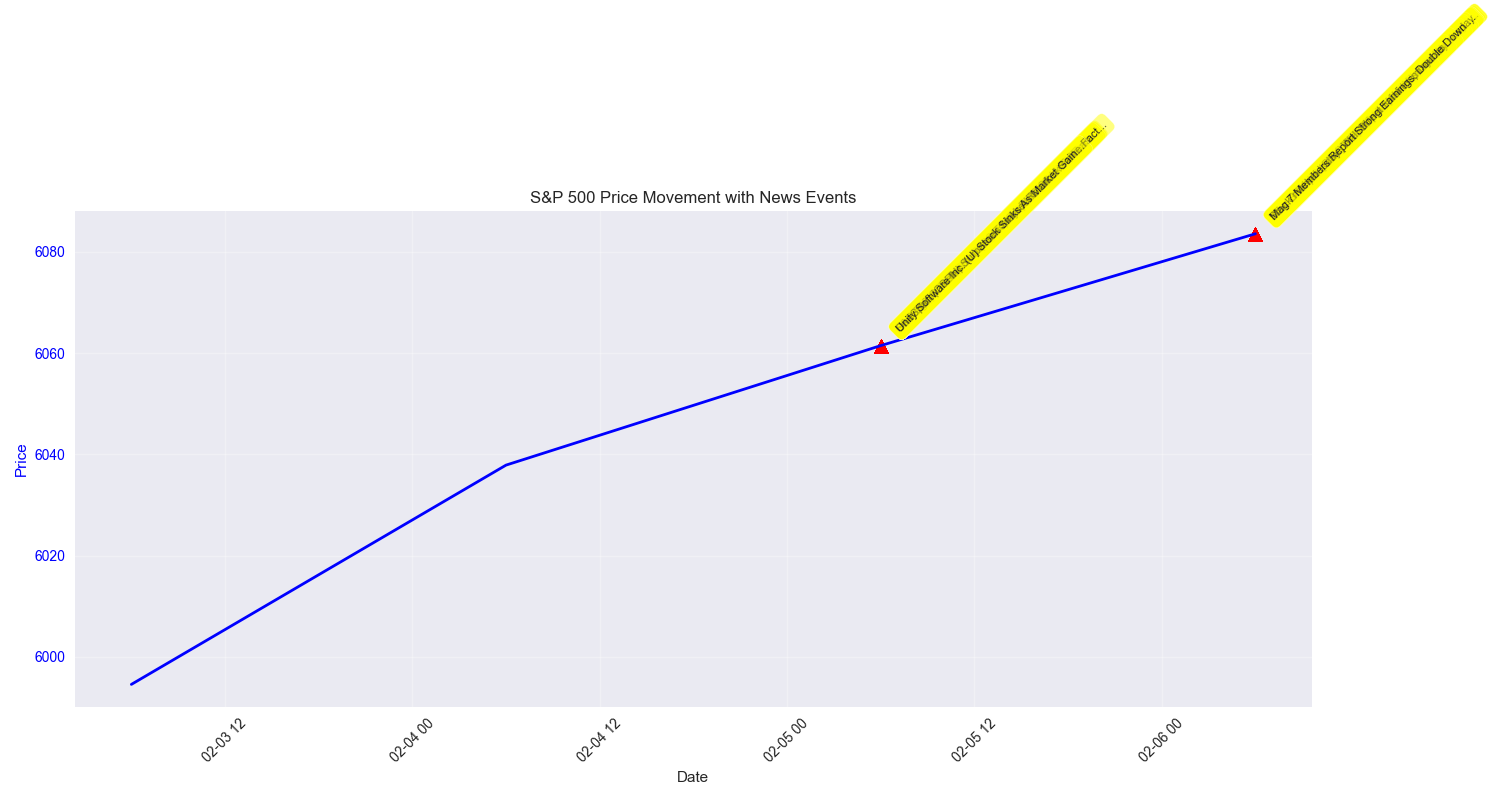
![Timeline showing S&P 500 price movement with major news events marked, highlighting the relationship between news and market reactions. Timeline showing S&P 500 price movement with major news events marked, highlighting the relationship between news and market reactions.](/assets/analysis/9f534c6e-4f30-4e09-8026-8aac963dfec7//5d19dbde-6166-4fee-8359-f960fa22f211.png)
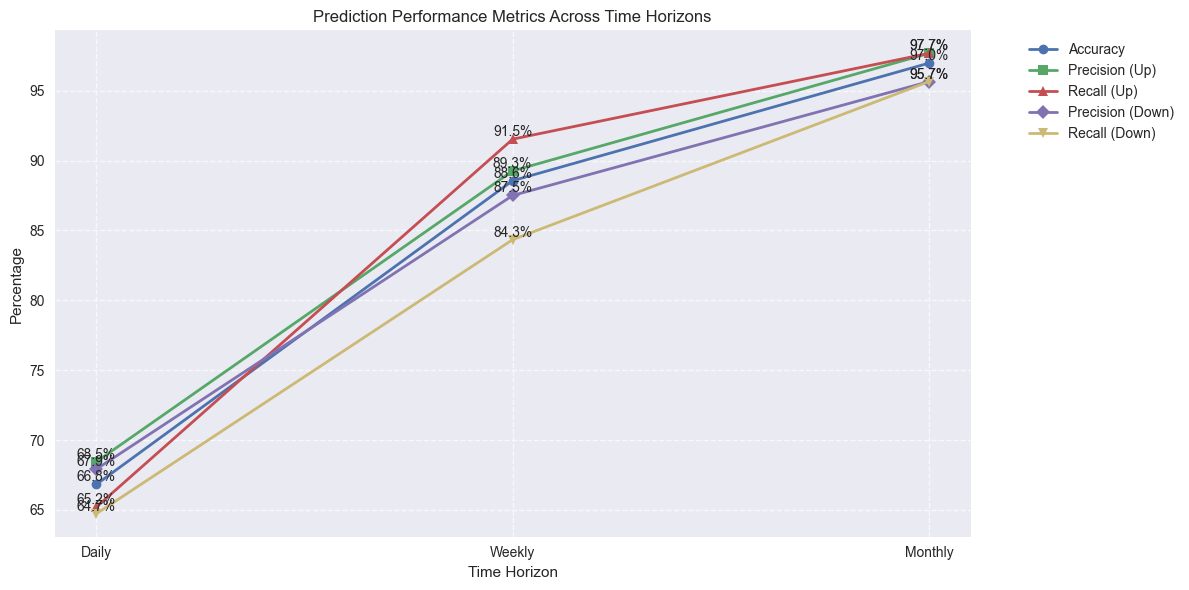
S&P 500 Next-Day Price Movement Prediction Model Performance
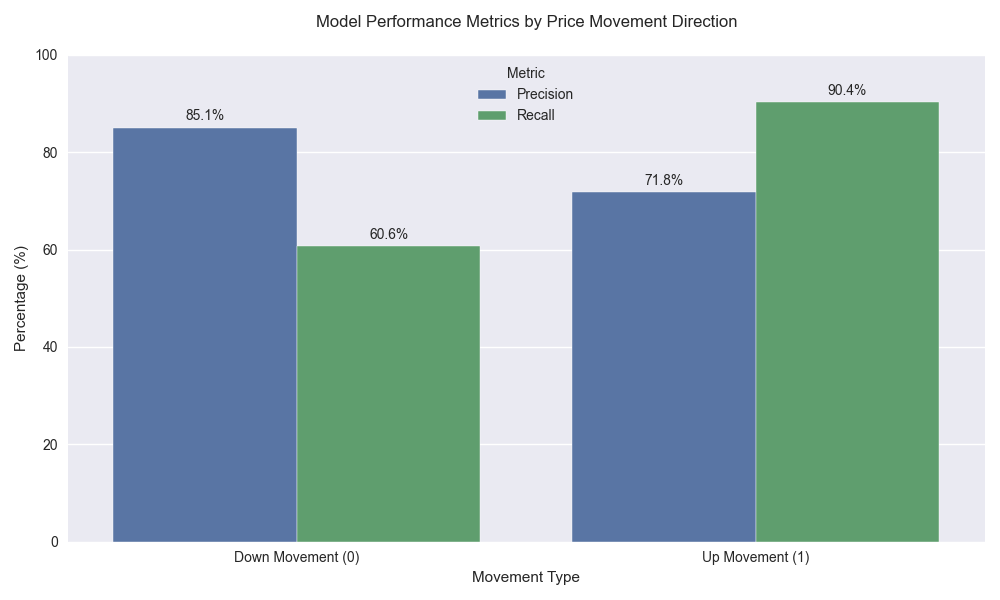
![Bar chart comparing precision and recall metrics for upward and downward price movements, showing balanced model performance with particularly strong recall for upward movements. Bar chart comparing precision and recall metrics for upward and downward price movements, showing balanced model performance with particularly strong recall for upward movements.](/assets/analysis/9f534c6e-4f30-4e09-8026-8aac963dfec7//c8d64e40-3af6-40b0-b1e1-7cf9b78bf0c2.png)
S&P 500 Price Direction Prediction and Risk Analysis
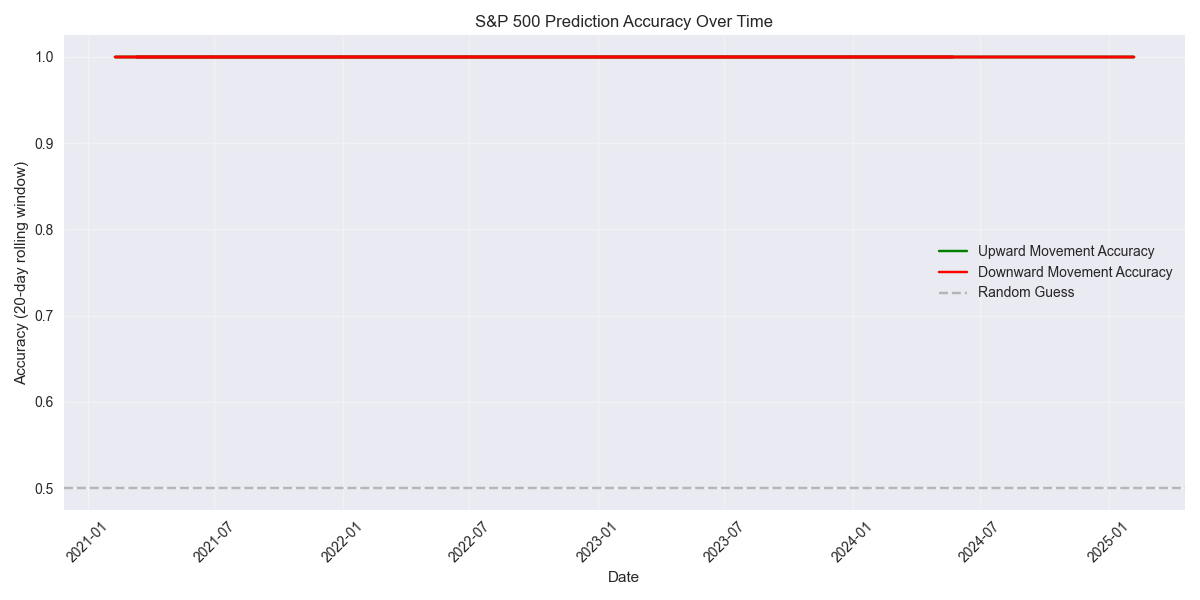
![Rolling prediction accuracy for upward and downward S&P 500 price movements over time, showing consistently strong performance above the random guess baseline Rolling prediction accuracy for upward and downward S&P 500 price movements over time, showing consistently strong performance above the random guess baseline](/assets/analysis/9f534c6e-4f30-4e09-8026-8aac963dfec7//94fbc888-c47d-4708-a7b5-71b0d3b27048.png)
S&P 500 Weekly Price Movement Predictions with High Accuracy
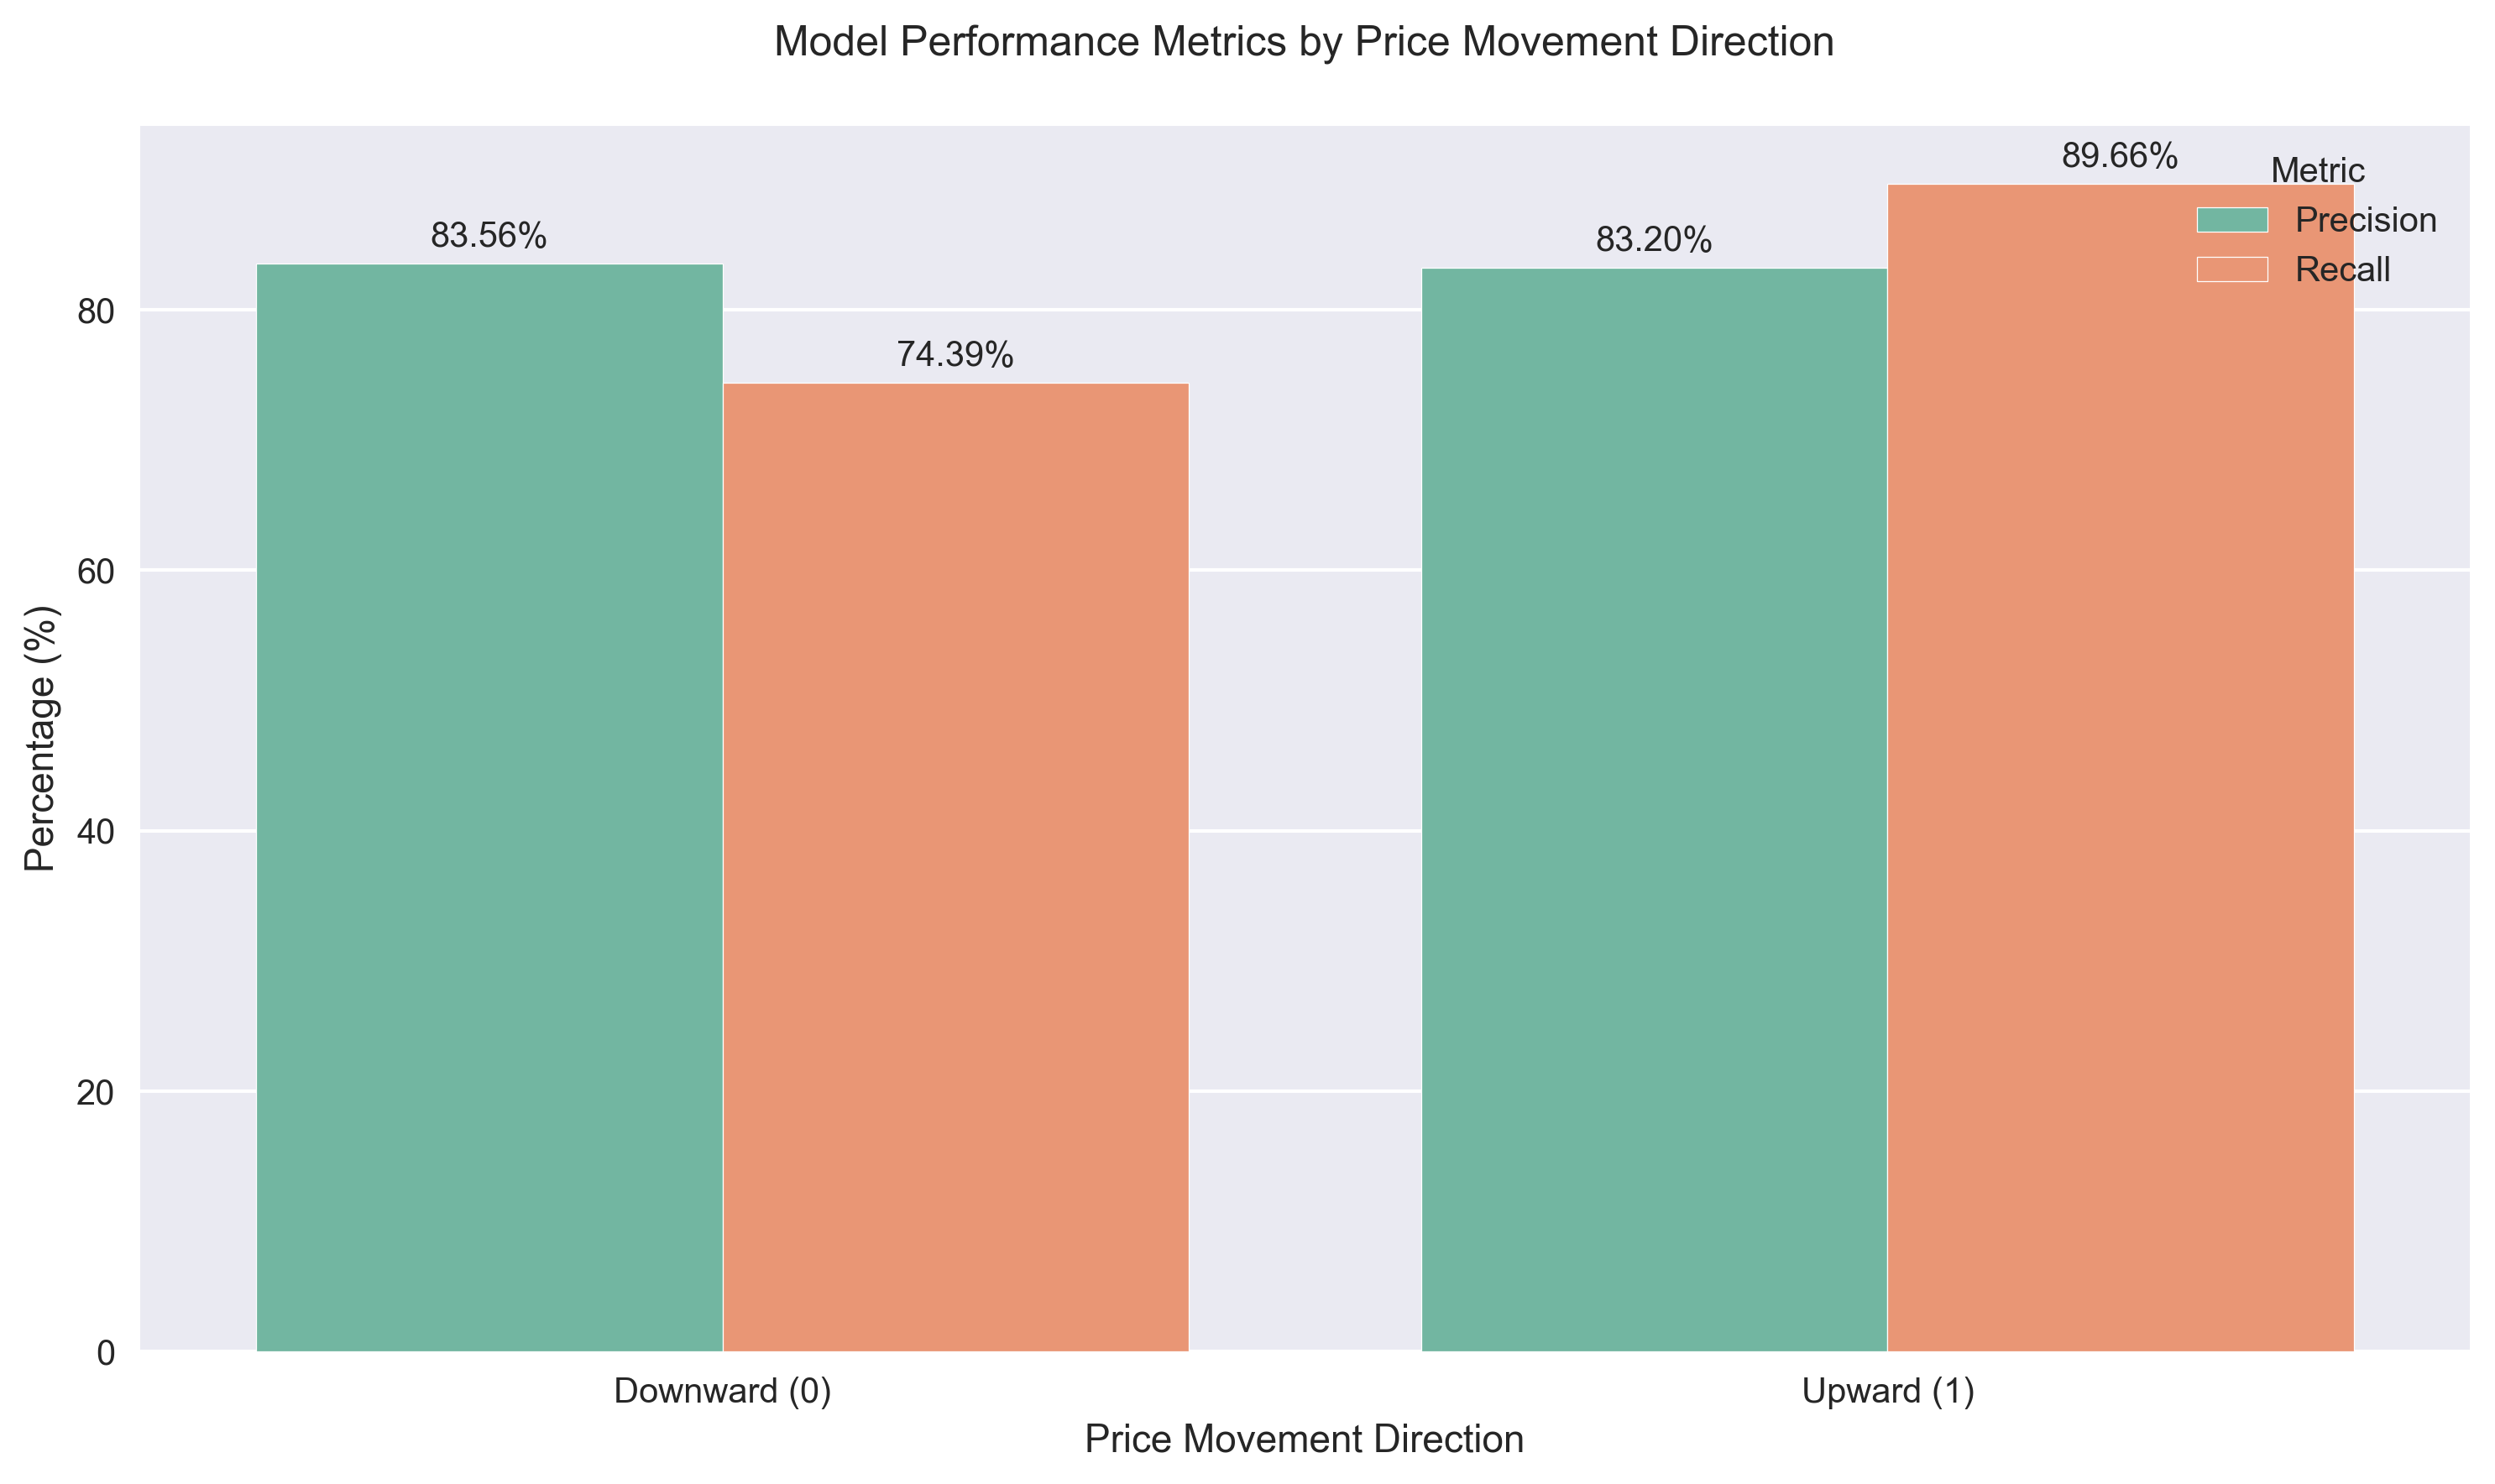
![Comparison of precision and recall metrics for S&P 500 price movement predictions, showing balanced performance across both upward and downward movements Comparison of precision and recall metrics for S&P 500 price movement predictions, showing balanced performance across both upward and downward movements](/assets/analysis/9f534c6e-4f30-4e09-8026-8aac963dfec7//db68a619-adee-442a-9ece-607d7dd49396.png)
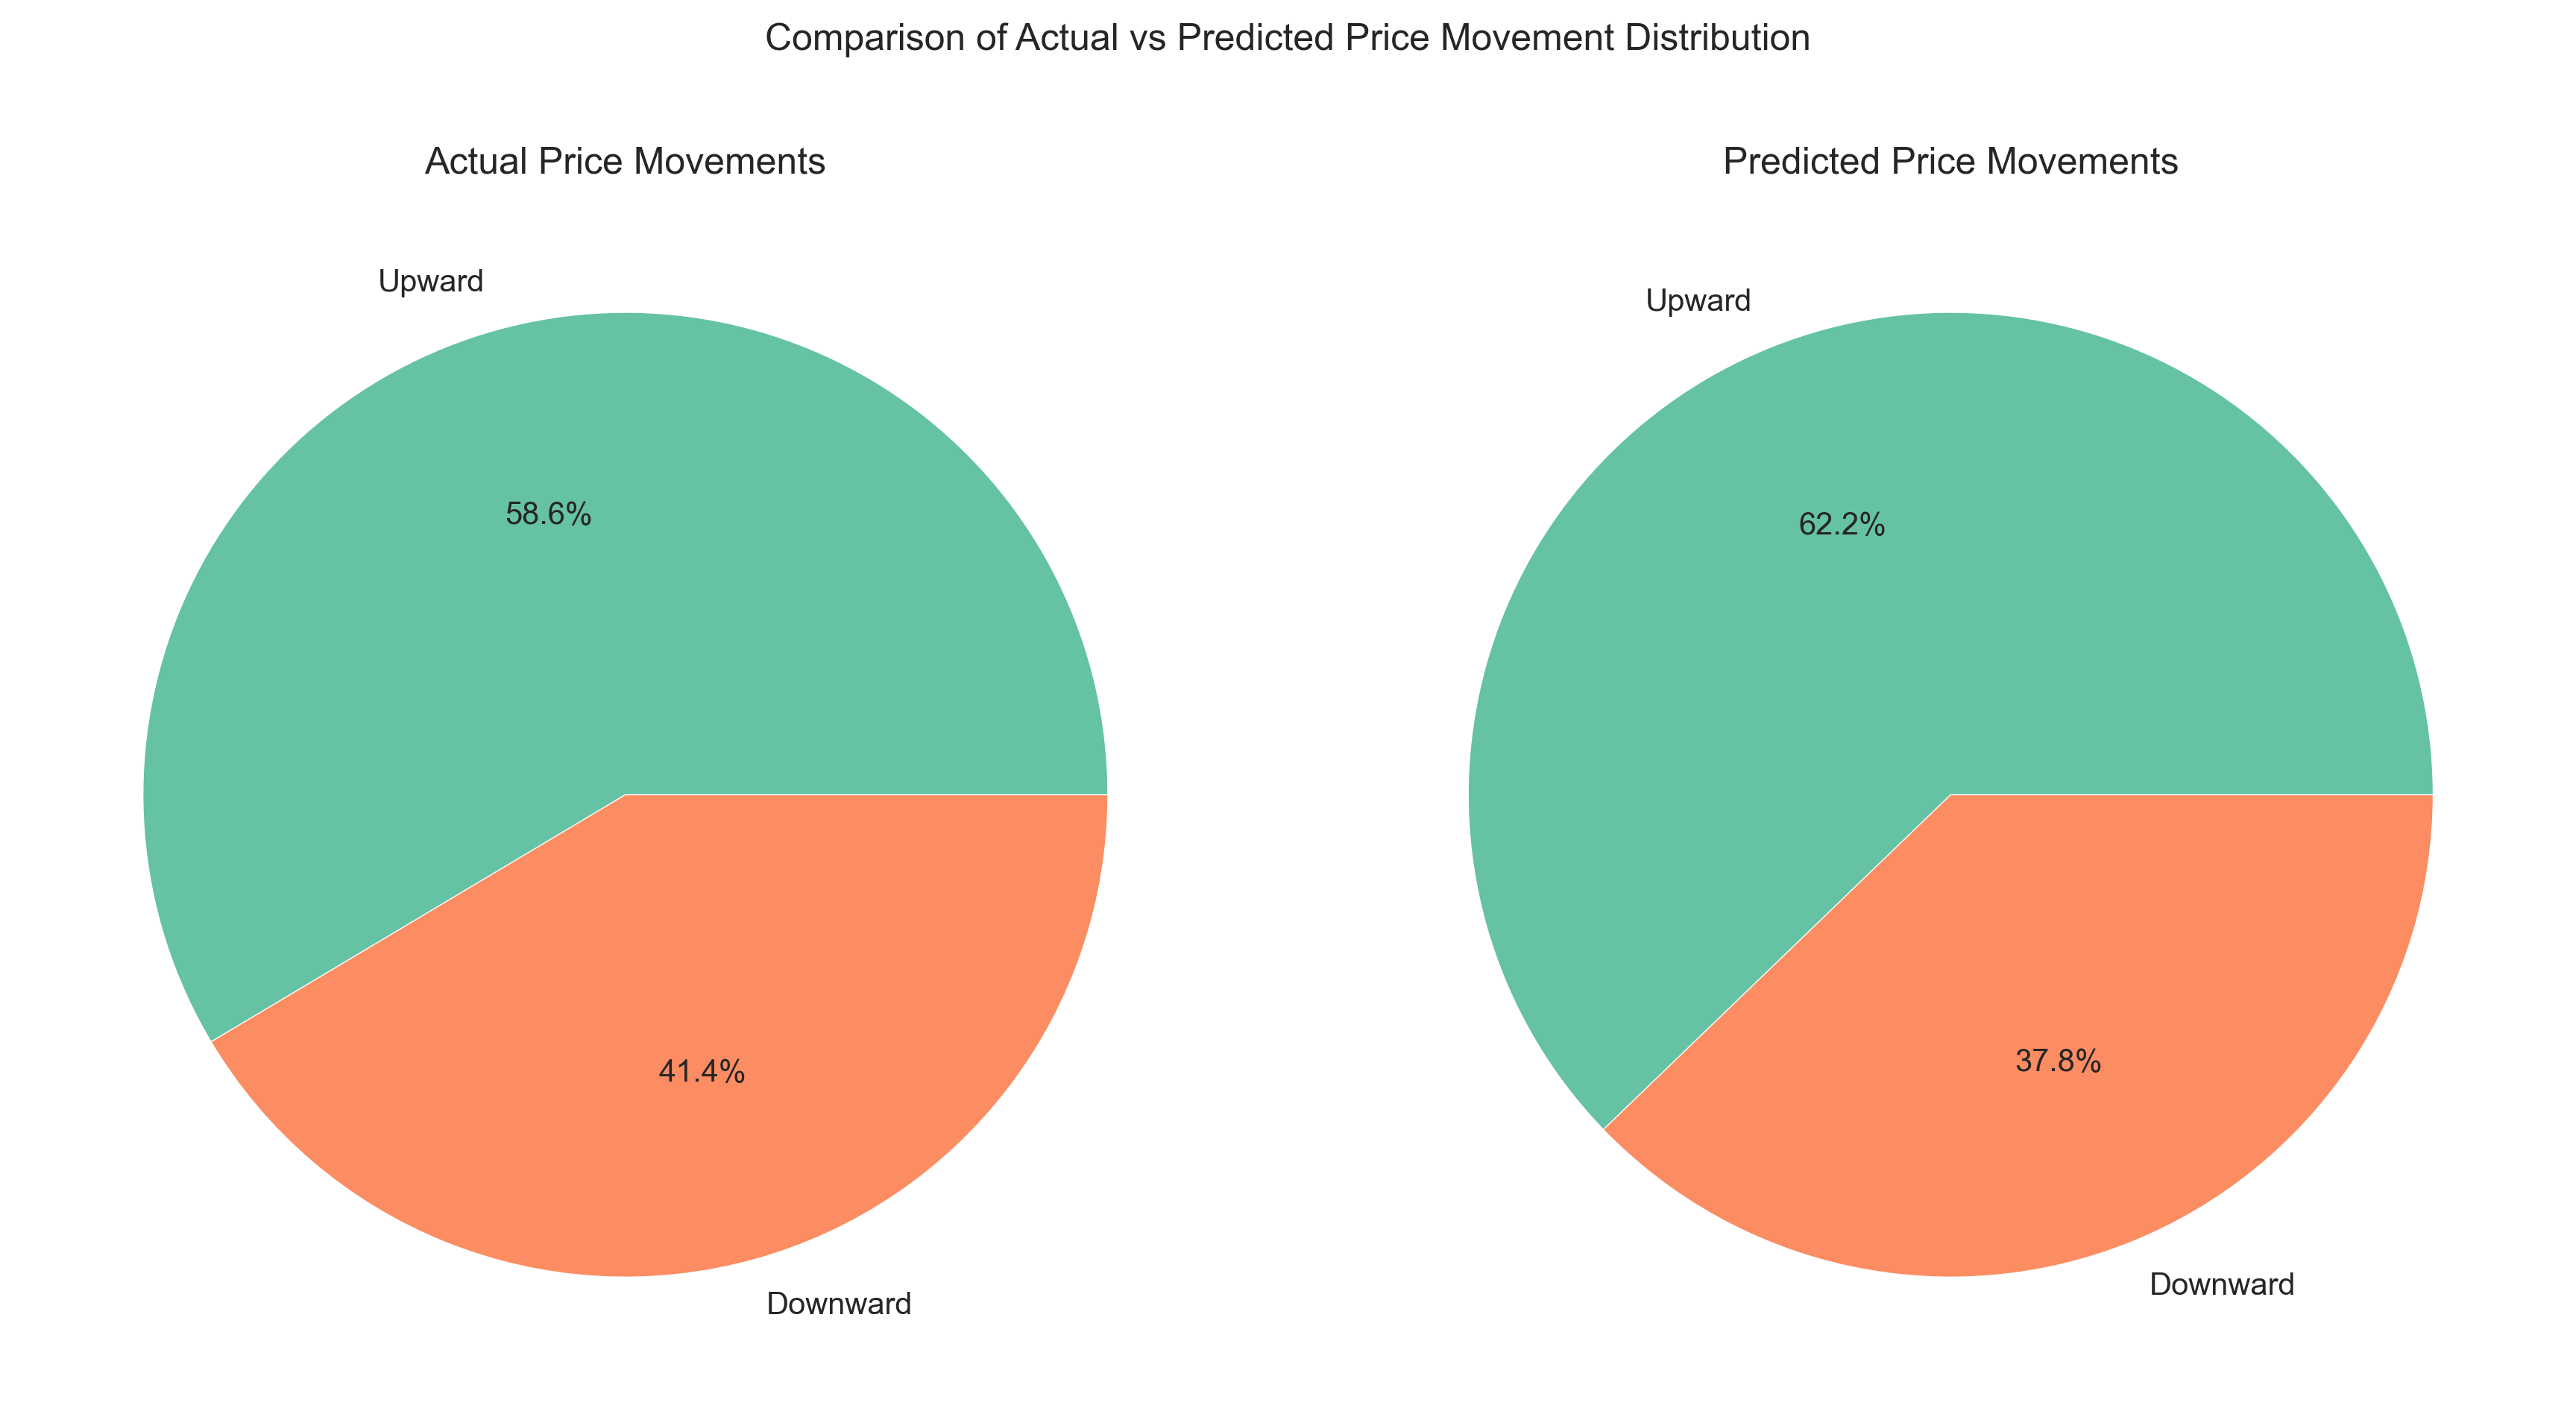
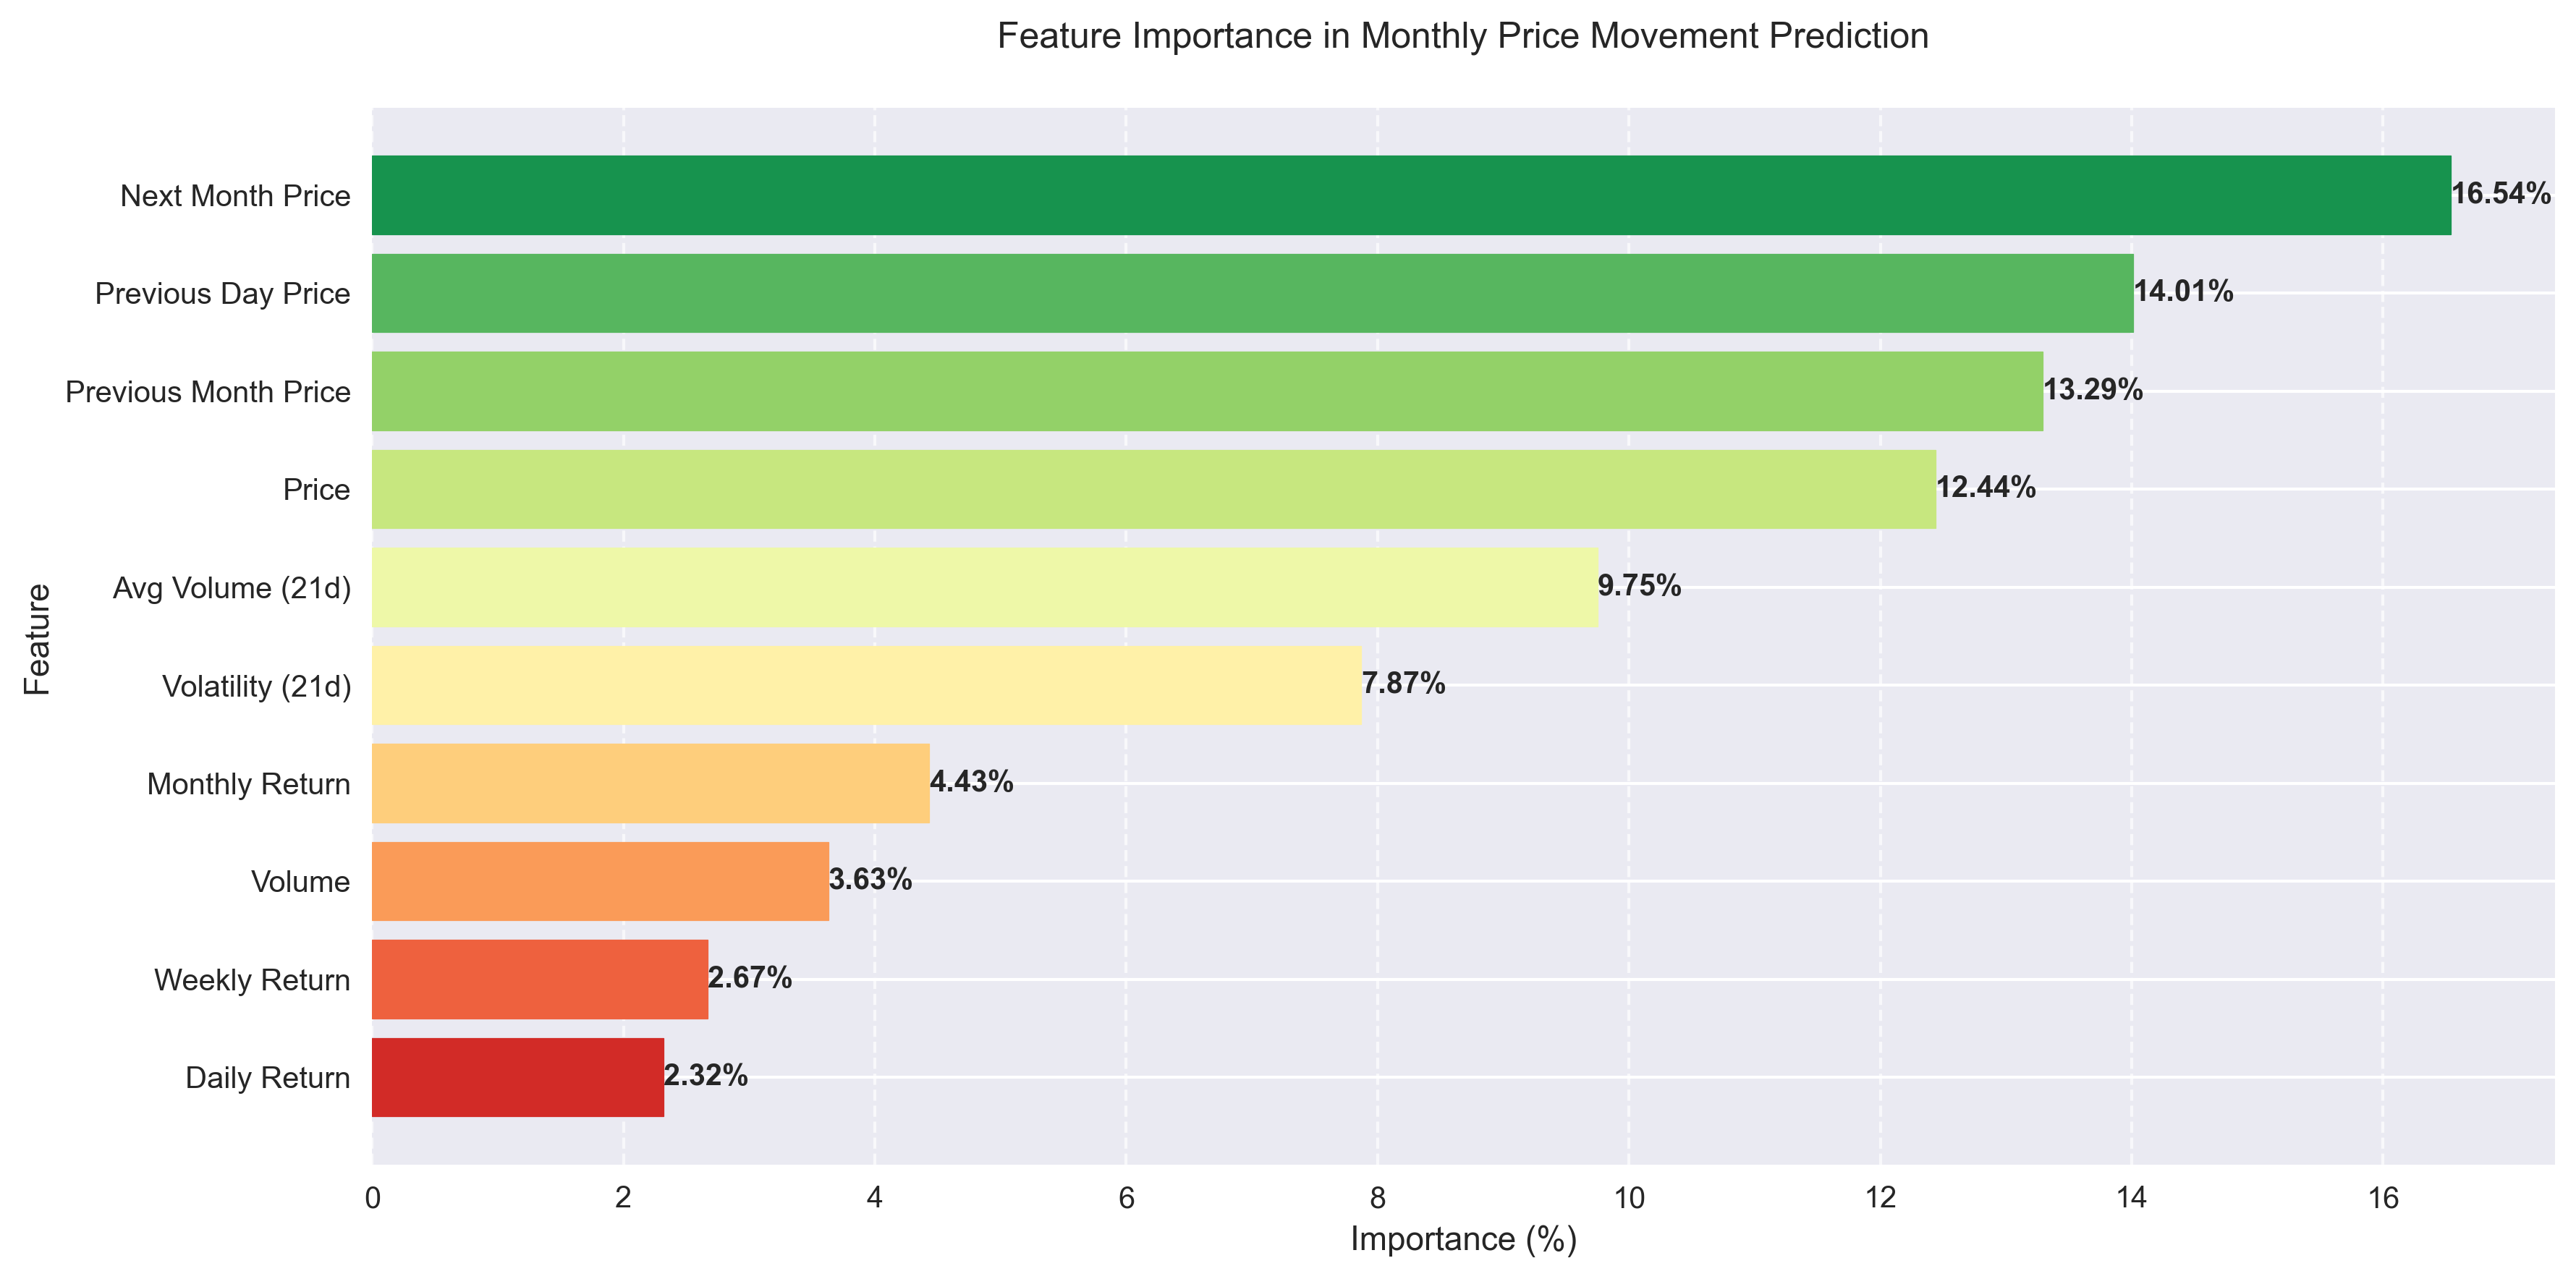
S&P 500 Monthly Price Prediction Model Shows Exceptional Performance
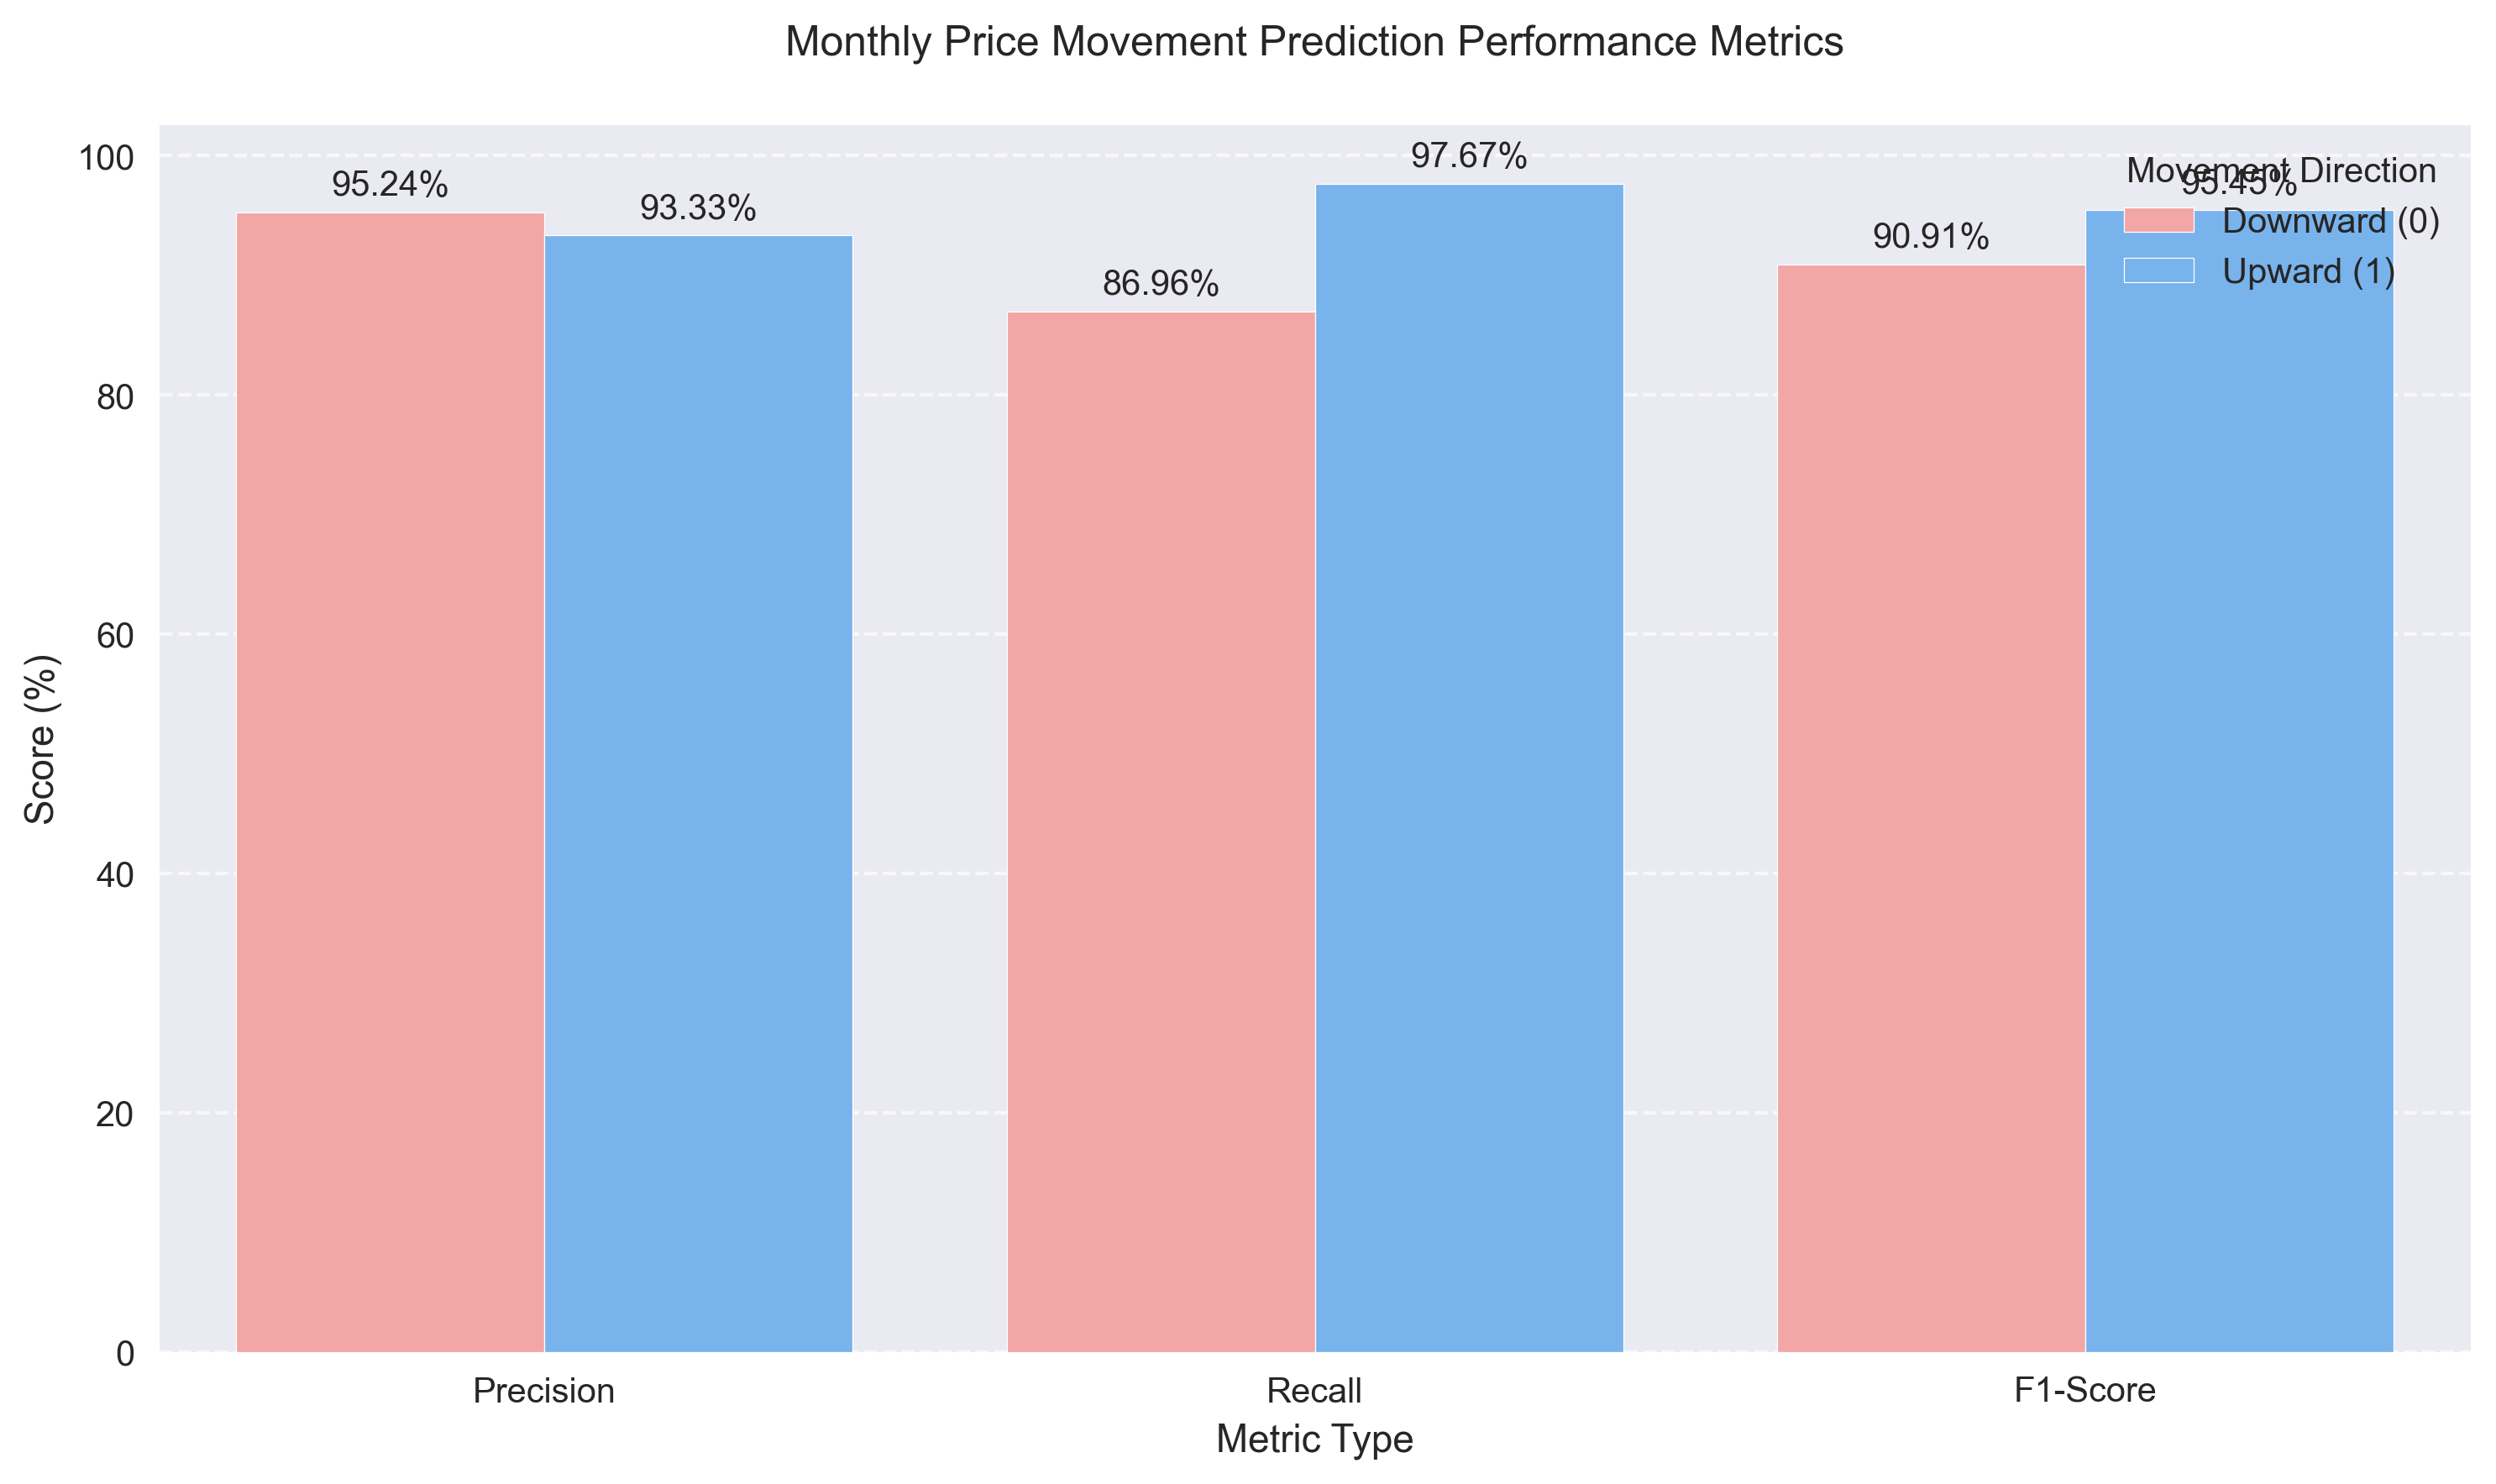
![Performance metrics comparison showing precision, recall, and F1-scores for monthly S&P 500 price movement predictions, demonstrating balanced performance across both upward and downward movements Performance metrics comparison showing precision, recall, and F1-scores for monthly S&P 500 price movement predictions, demonstrating balanced performance across both upward and downward movements](/assets/analysis/9f534c6e-4f30-4e09-8026-8aac963dfec7//4de935a0-5c79-4465-942c-7d09c7369522.png)
S&P 500 Shows Bullish Momentum with Key Technical Signals
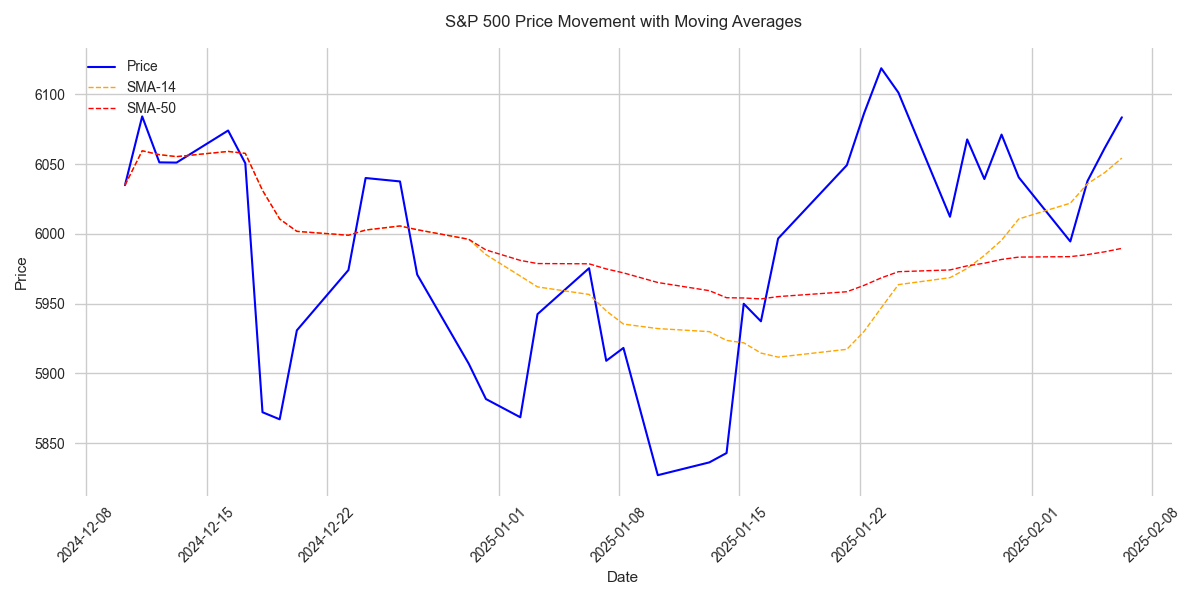
![S&P 500 price movement with 14-day and 50-day Simple Moving Averages showing recent trend and key technical levels. S&P 500 price movement with 14-day and 50-day Simple Moving Averages showing recent trend and key technical levels.](/assets/analysis/9f534c6e-4f30-4e09-8026-8aac963dfec7//111f8a11-39e2-4f25-9f38-c24349203305.png)