Treasury Futures Trading Insights and Predictions
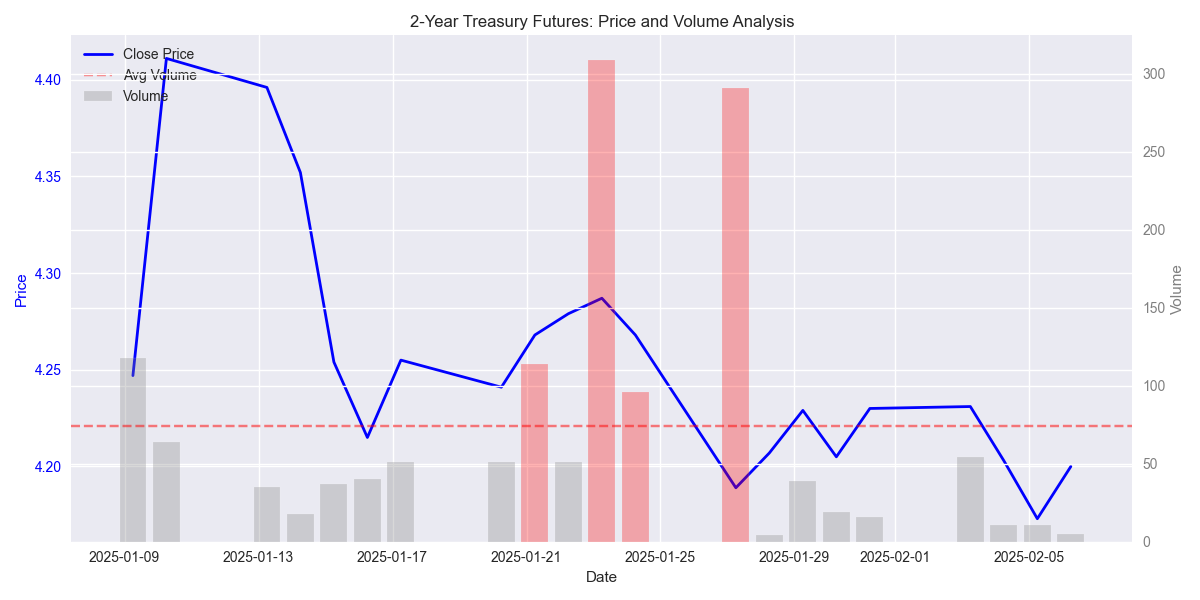
2Y Treasury Futures Set for Major Move as Volume Dries Up
Bearish Pressure Persists Despite Price Stabilization
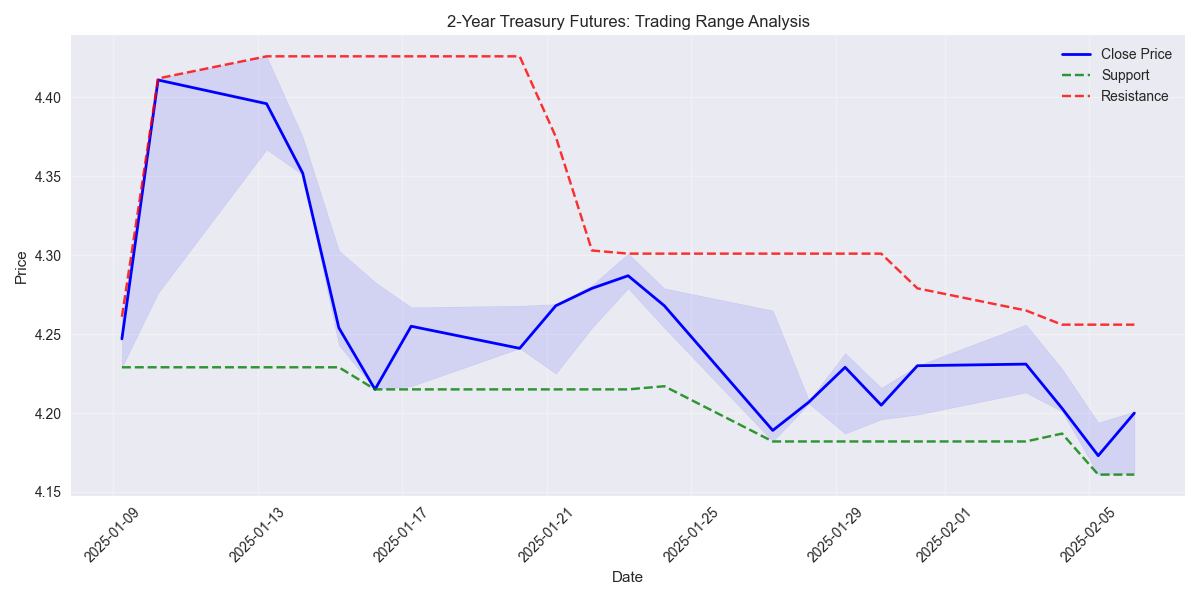
Trading Range Narrows as Volatility Stabilizes
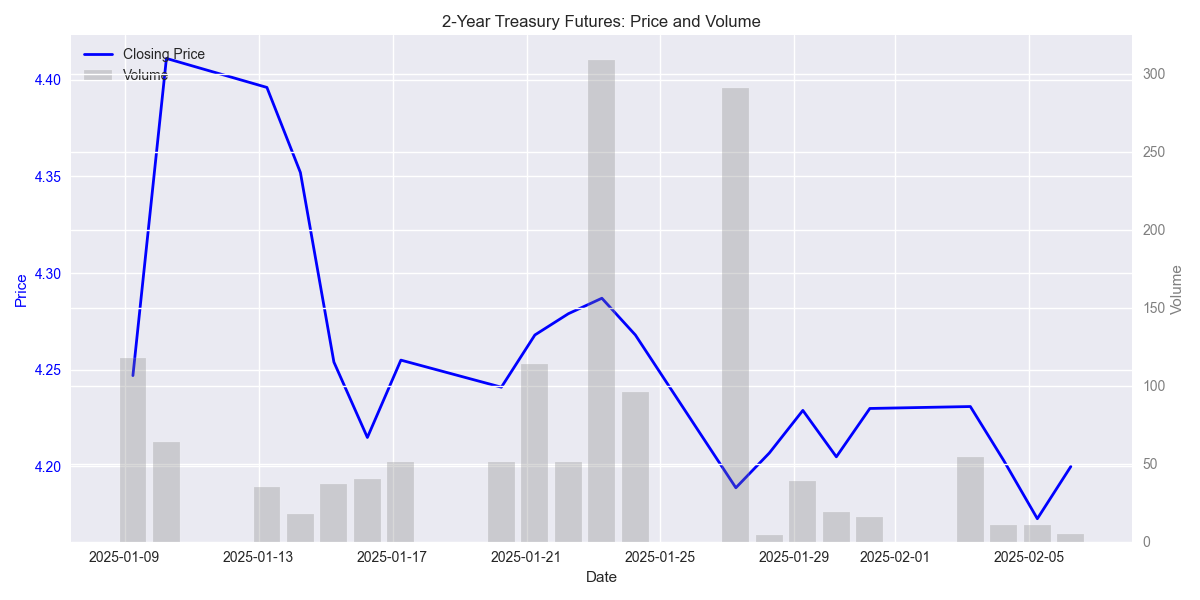
Recent Price Action Shows Increased Volatility and Bearish Trend
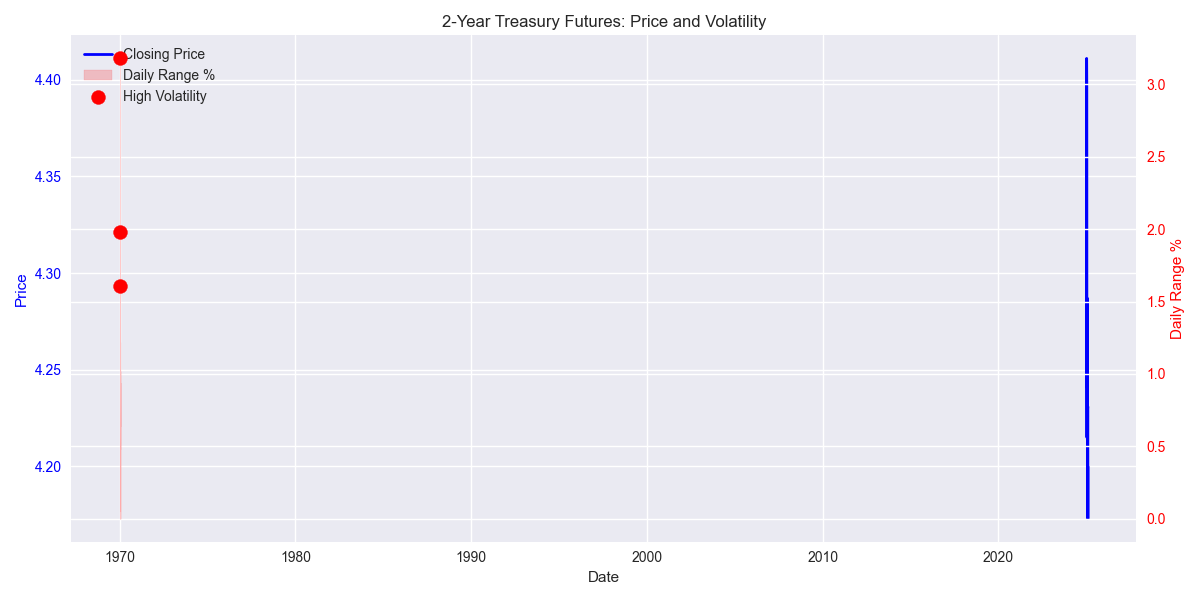
![2-Year Treasury Futures price movement and daily trading ranges over the past month, with highlighted high volatility events. 2-Year Treasury Futures price movement and daily trading ranges over the past month, with highlighted high volatility events.](/assets/analysis/3ea38d0c-d15b-48e4-a473-30989ae88bcd//f0641d3b-7a61-40ca-9b32-017137928f93.png)
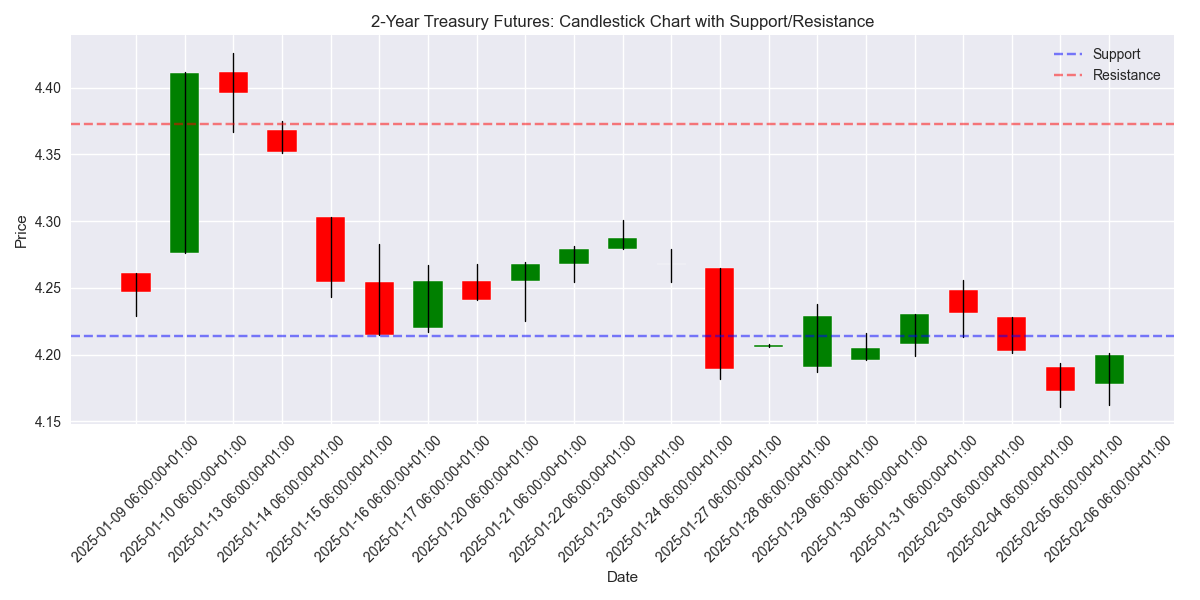
Technical Analysis Signals Point to Continued Bearish Pressure
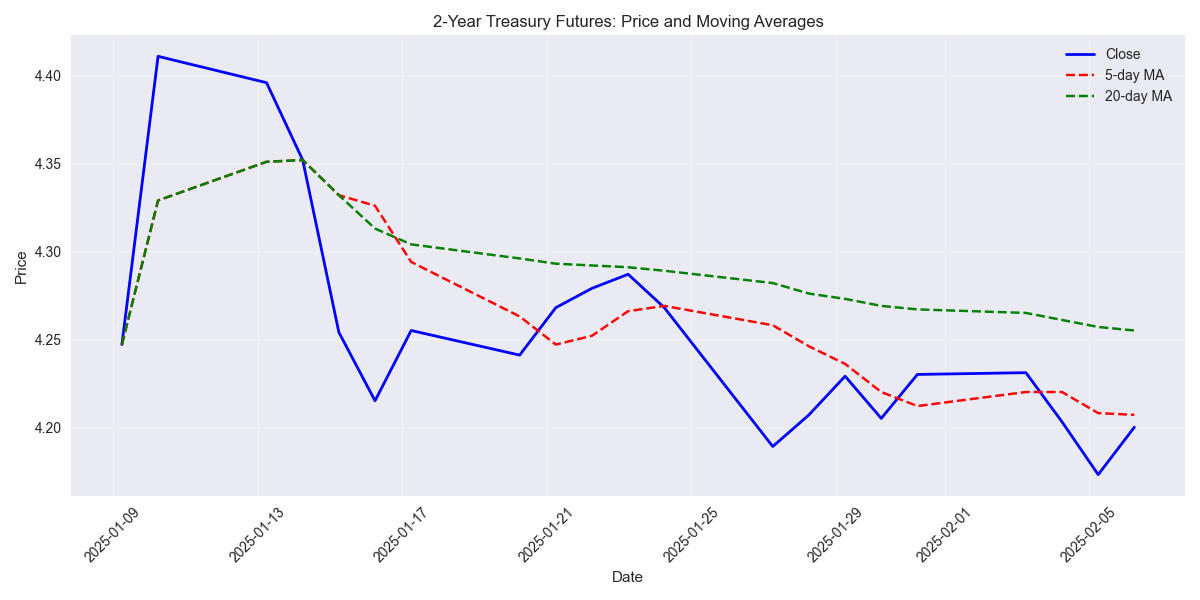
![2-Year Treasury Futures price with 5-day and 20-day moving averages showing bearish trend structure. 2-Year Treasury Futures price with 5-day and 20-day moving averages showing bearish trend structure.](/assets/analysis/3ea38d0c-d15b-48e4-a473-30989ae88bcd//a2fc48fa-9560-4a83-9150-4c1eb0b8228c.png)
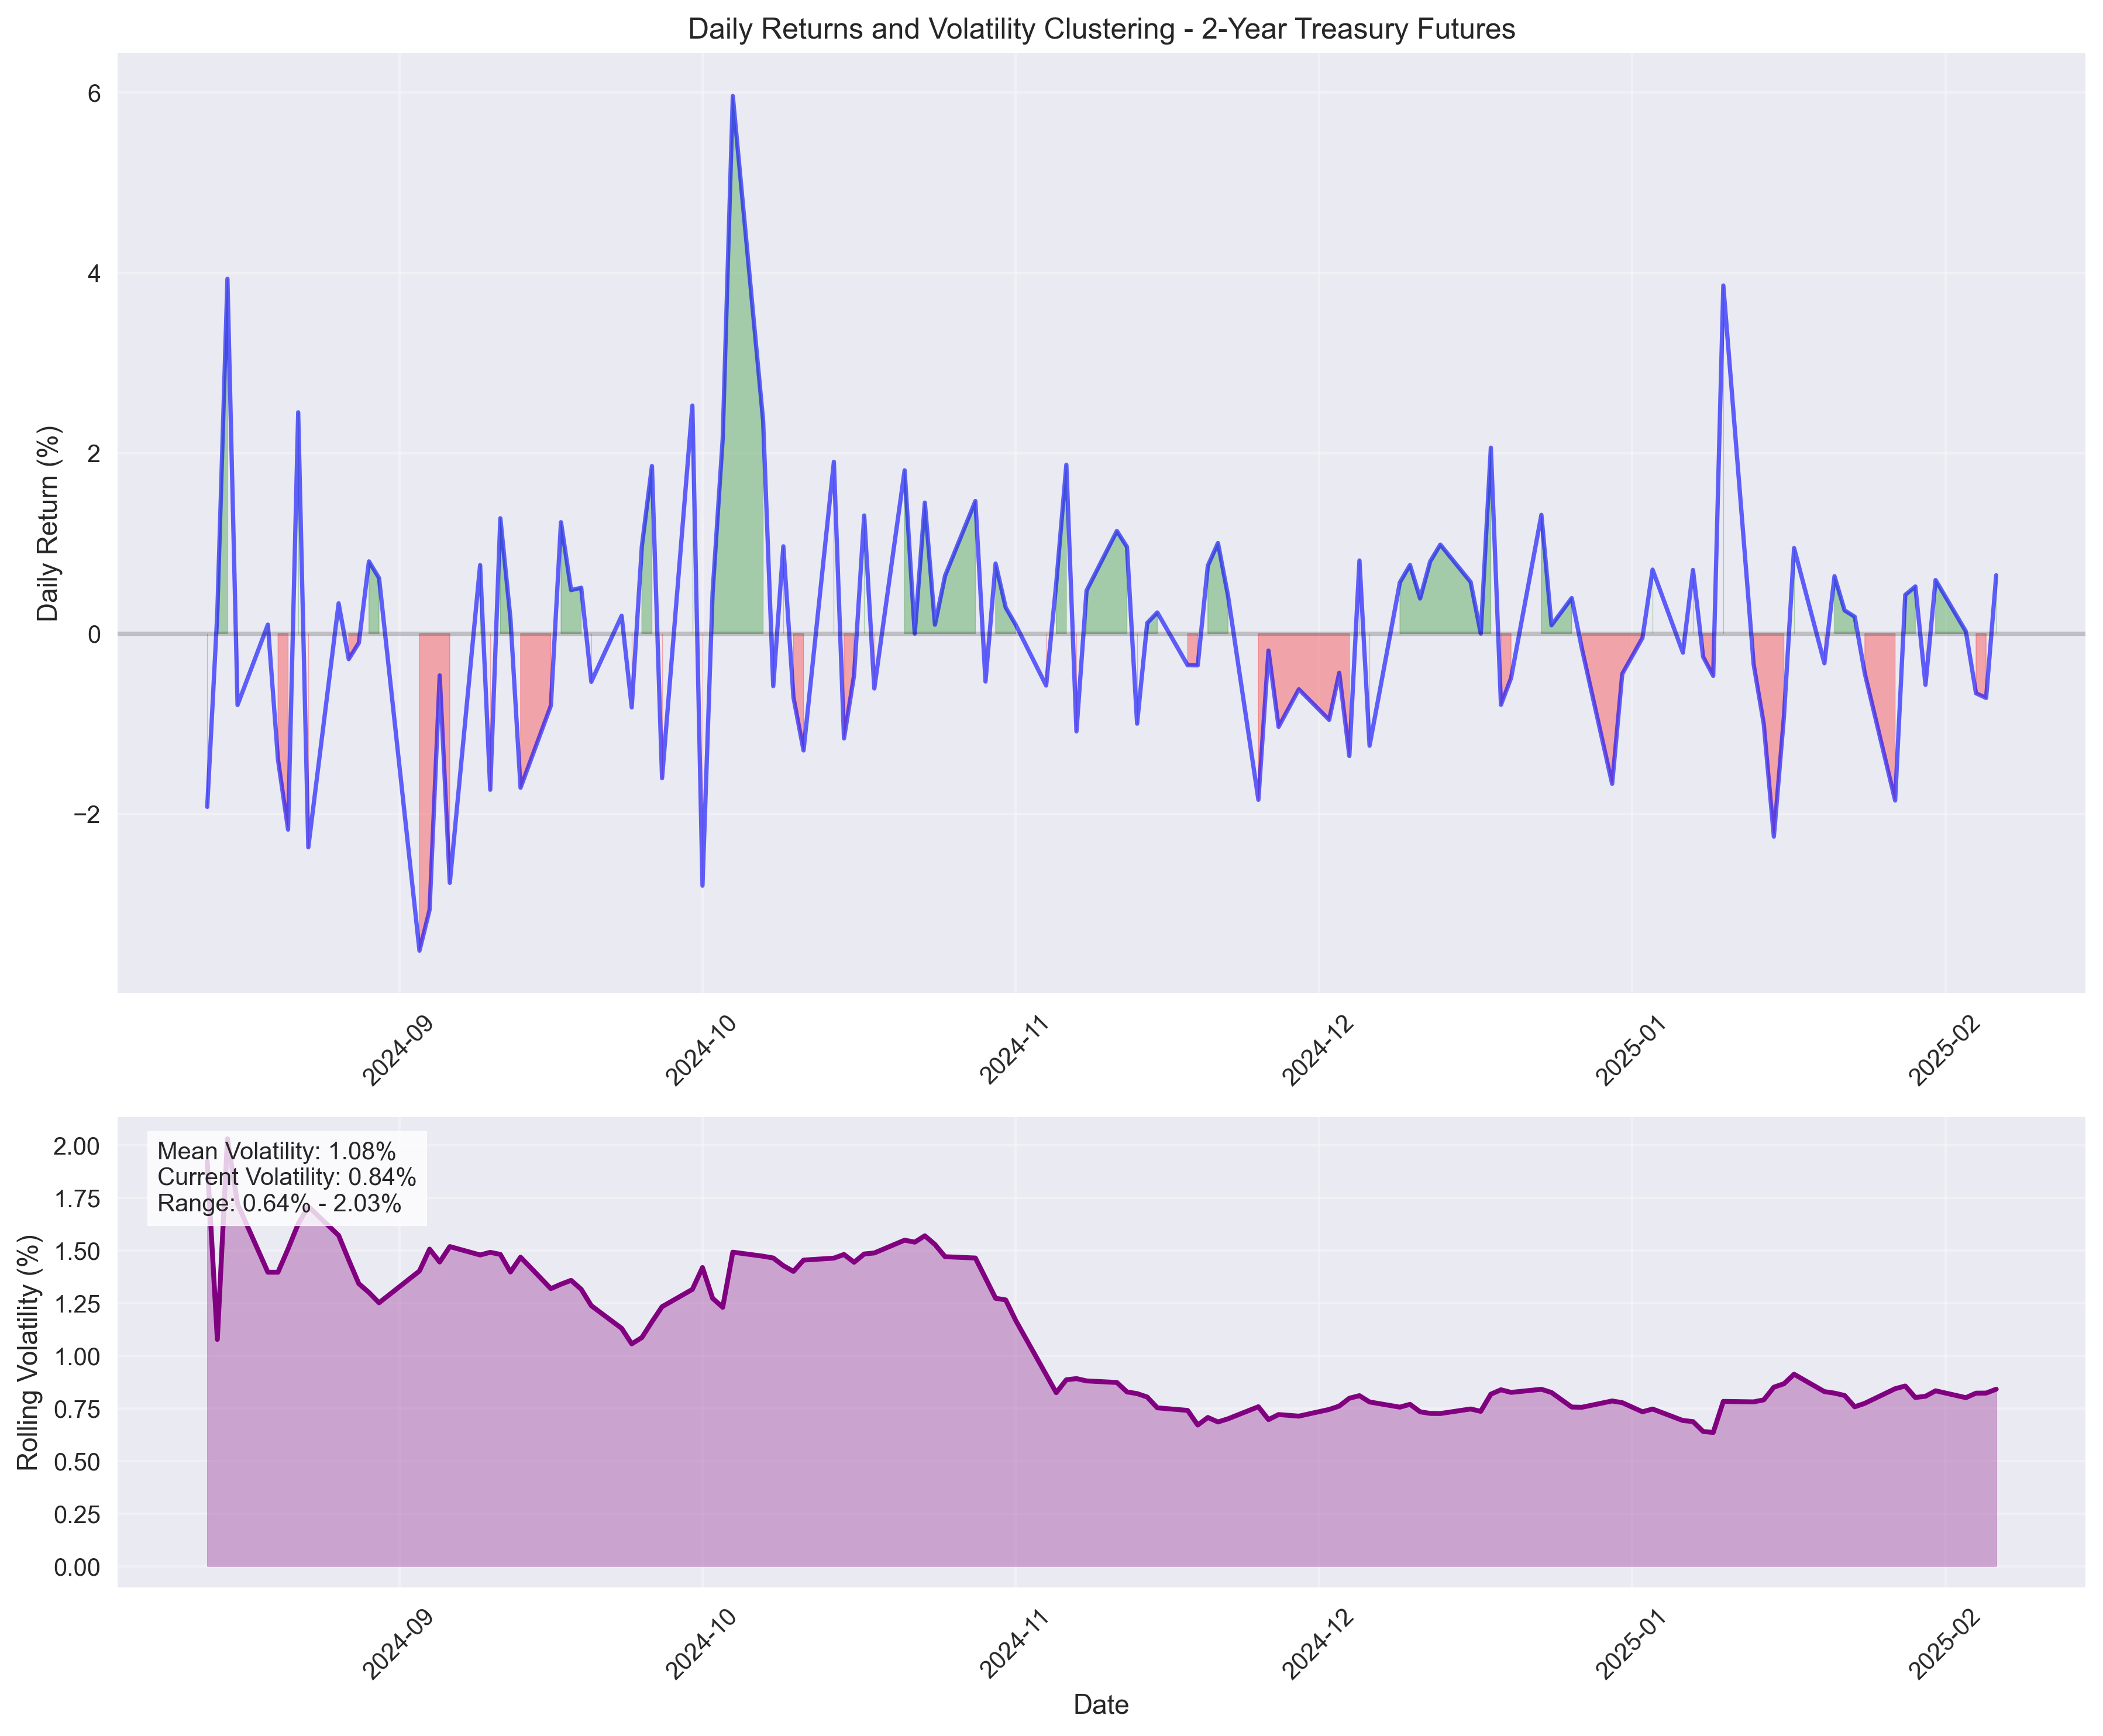
Short-term Volatility and Trading Range Analysis Reveals Key Levels
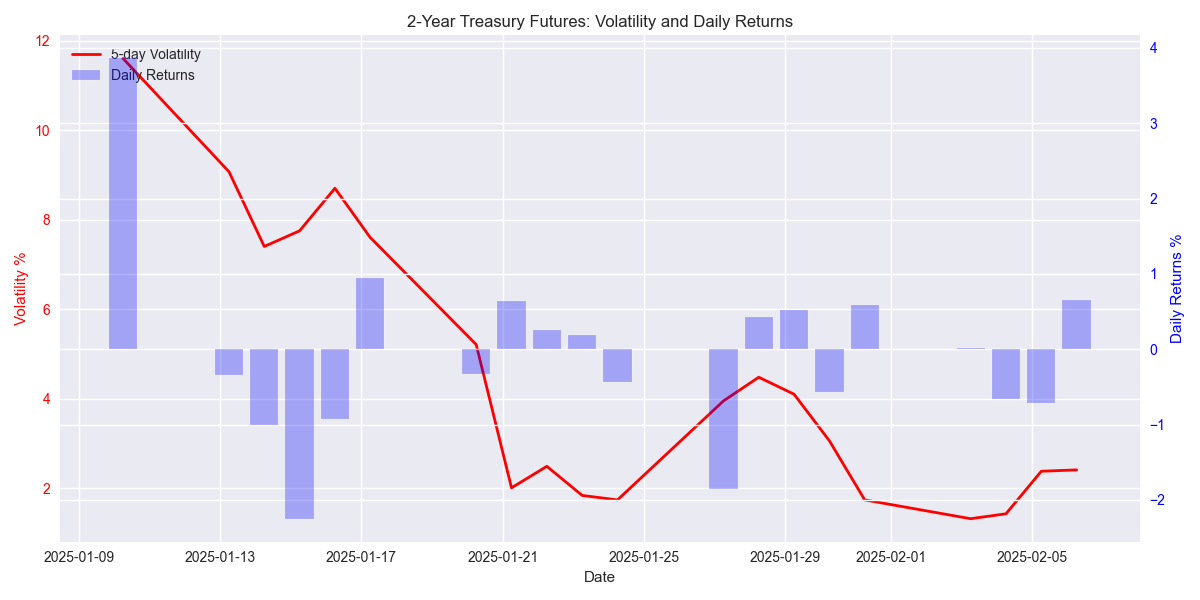
![5-day volatility trend with daily returns showing stabilization in price movements. 5-day volatility trend with daily returns showing stabilization in price movements.](/assets/analysis/3ea38d0c-d15b-48e4-a473-30989ae88bcd//5349cd48-e568-4f4f-88e0-48ac7339c981.png)
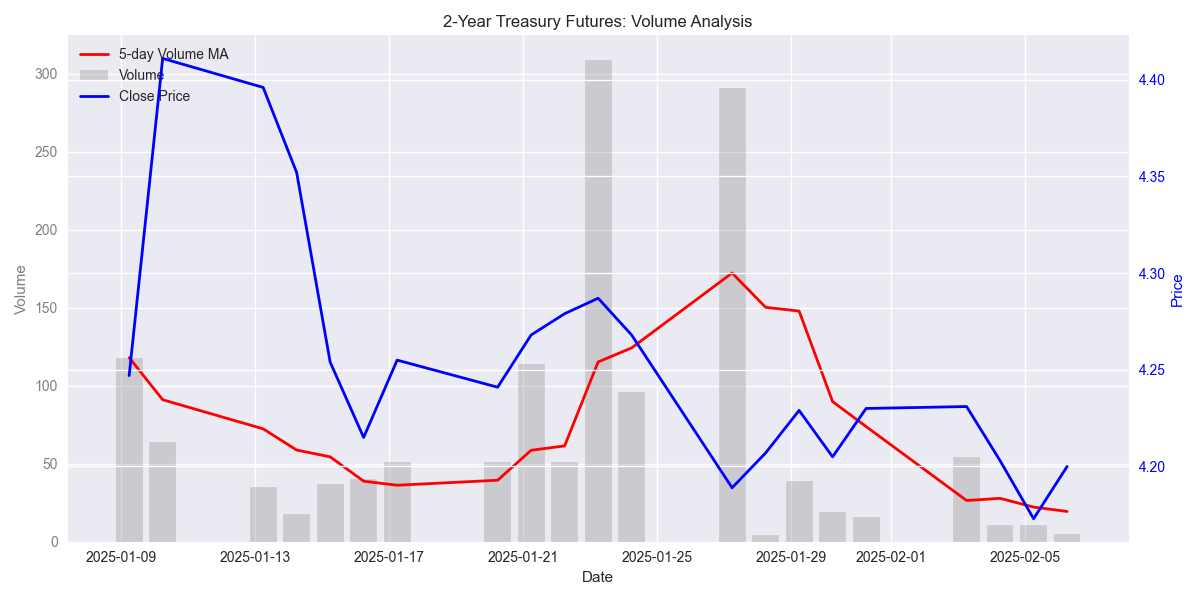
Volume Analysis Reveals Potential Market Exhaustion
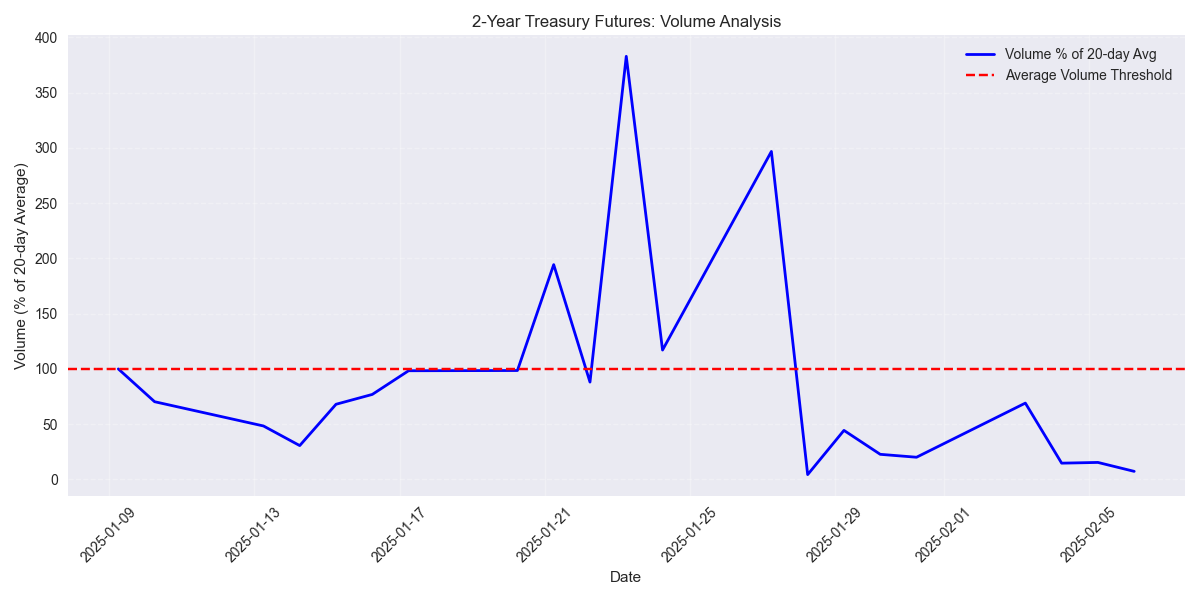
![Daily volume as a percentage of 20-day moving average, highlighting periods of above and below average trading activity. Daily volume as a percentage of 20-day moving average, highlighting periods of above and below average trading activity.](/assets/analysis/3ea38d0c-d15b-48e4-a473-30989ae88bcd//c8aef082-137b-42b9-9d5b-4fa2ea5aa3c5.png)
Initial Price Prediction Model Analysis for 2-Year Treasury Futures
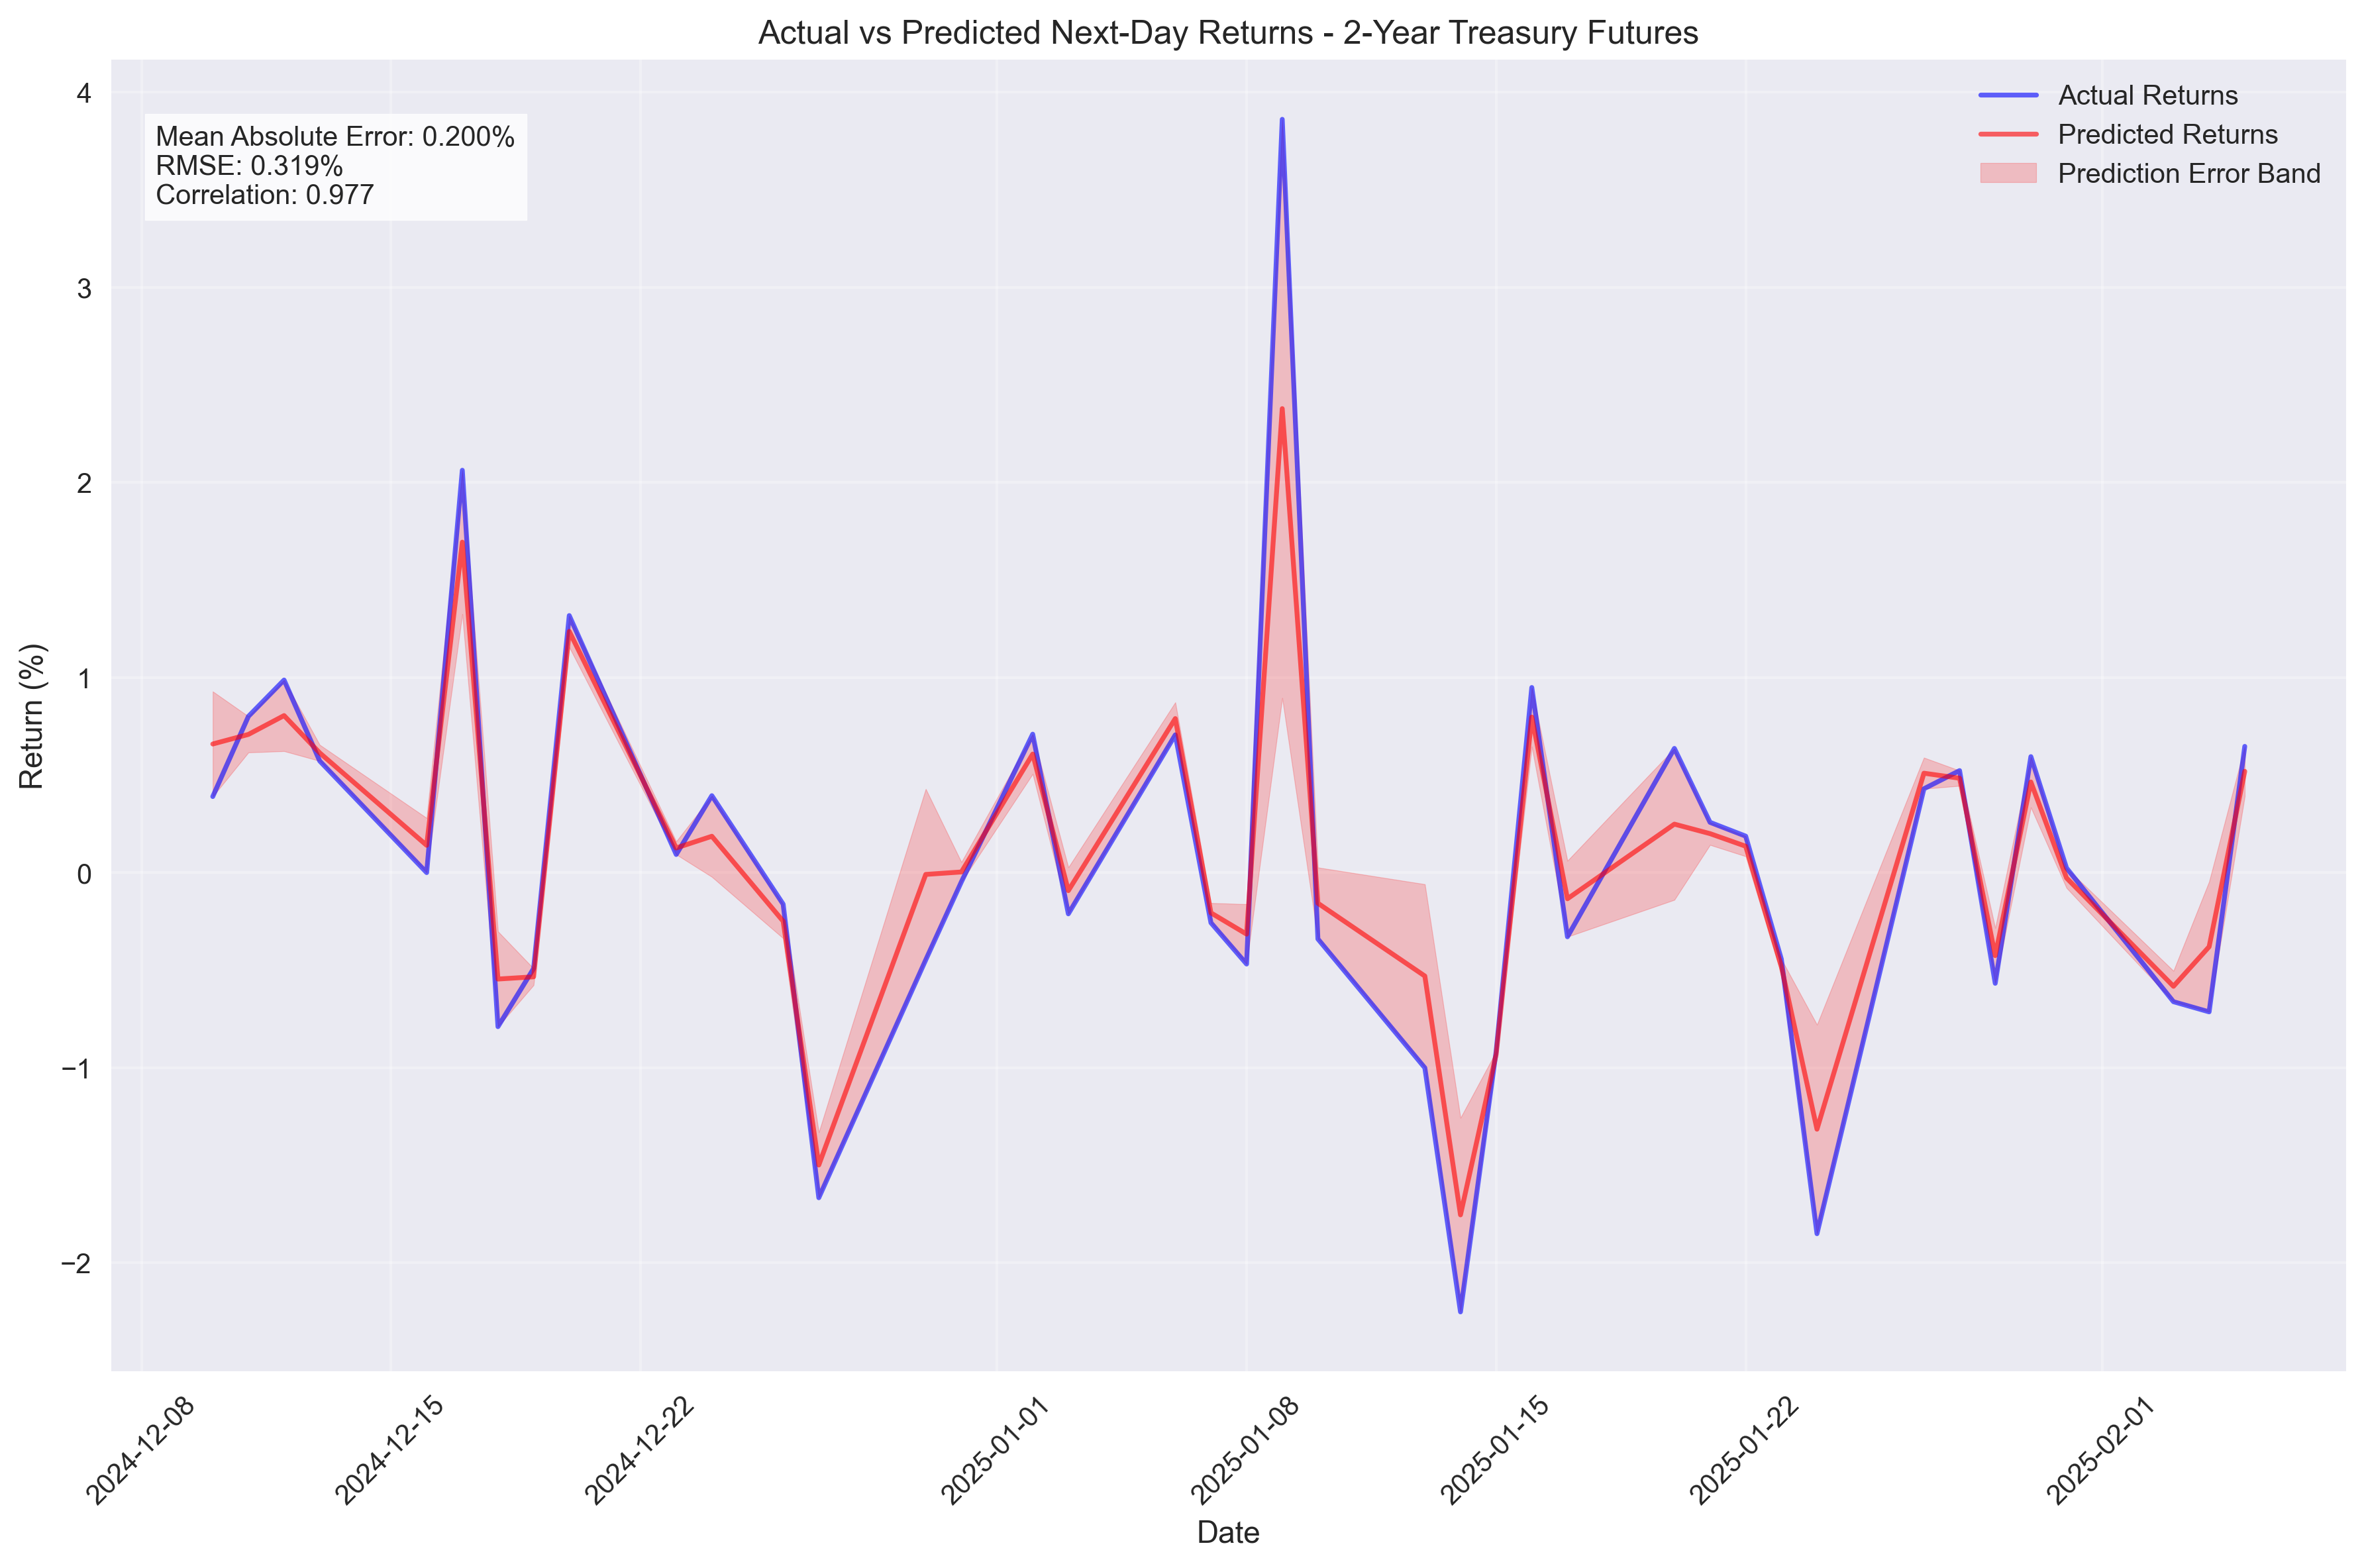
![Comparison of predicted vs actual next-day returns for 2-Year Treasury Futures, showing prediction accuracy and error bands over time. Comparison of predicted vs actual next-day returns for 2-Year Treasury Futures, showing prediction accuracy and error bands over time.](/assets/analysis/3ea38d0c-d15b-48e4-a473-30989ae88bcd//659658e2-6de0-450b-8053-06fcbf6dfef4.png)