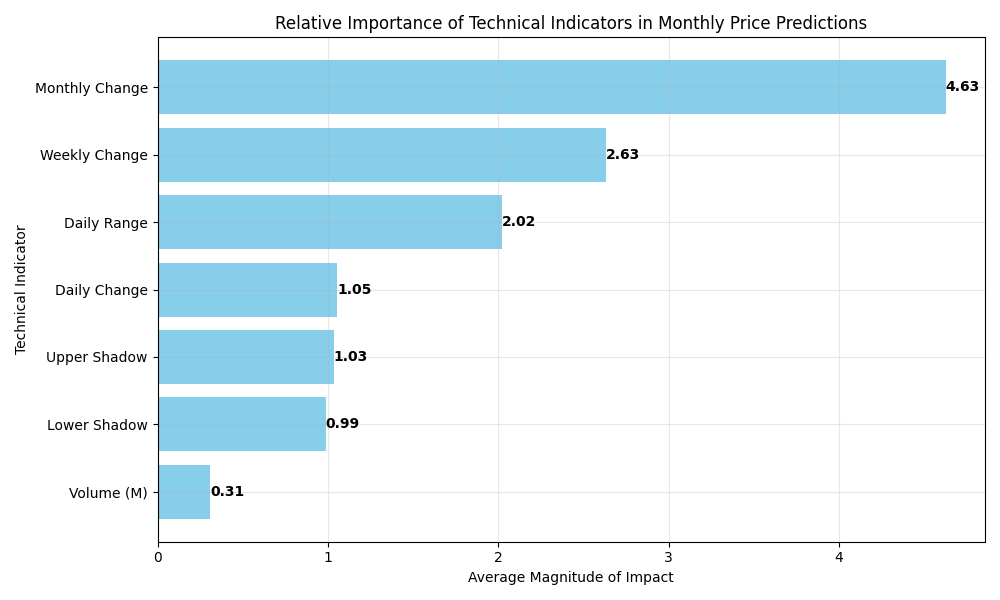
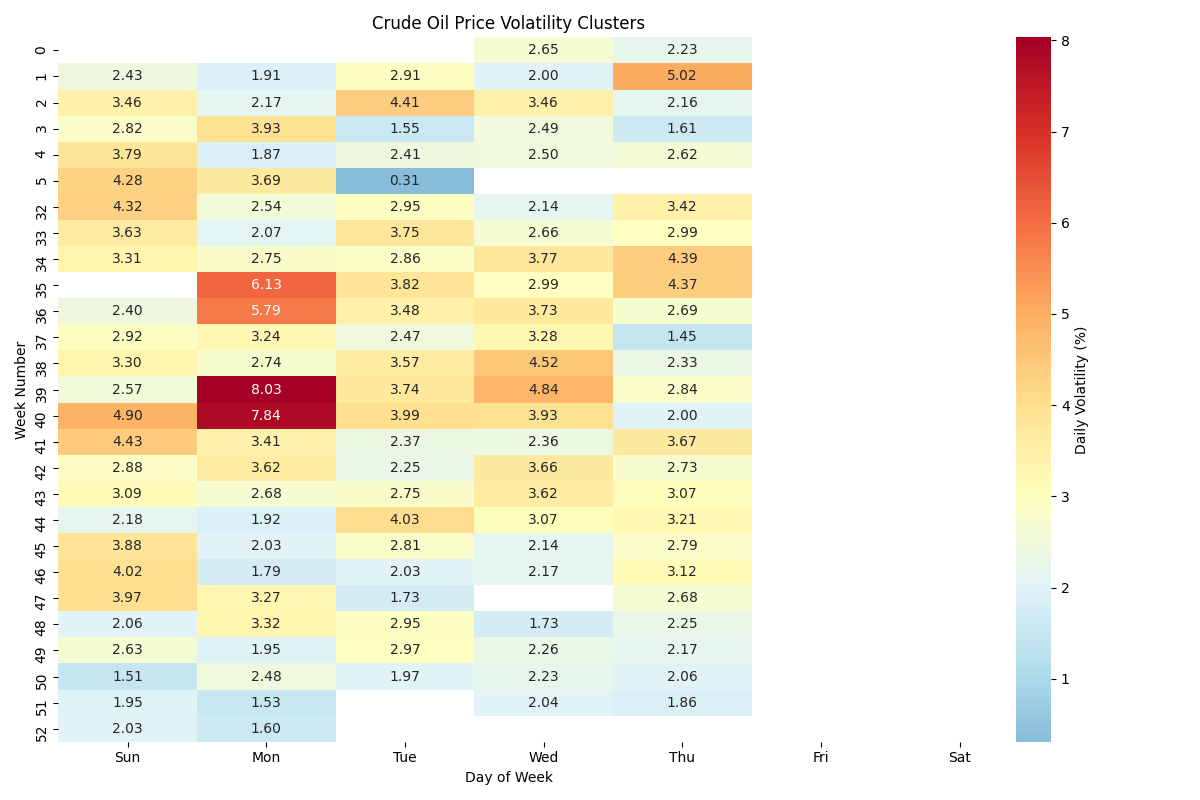
Crude Oil Market Insights: Trader's Quick Guide
Crude Oil in Bearish Territory with Clear Trading Boundaries
Volume Patterns Signal Major Price Move Ahead
Short-Term Models Predict Further Downside
Monthly Price Target: $72-75 Range with Volatility Warning
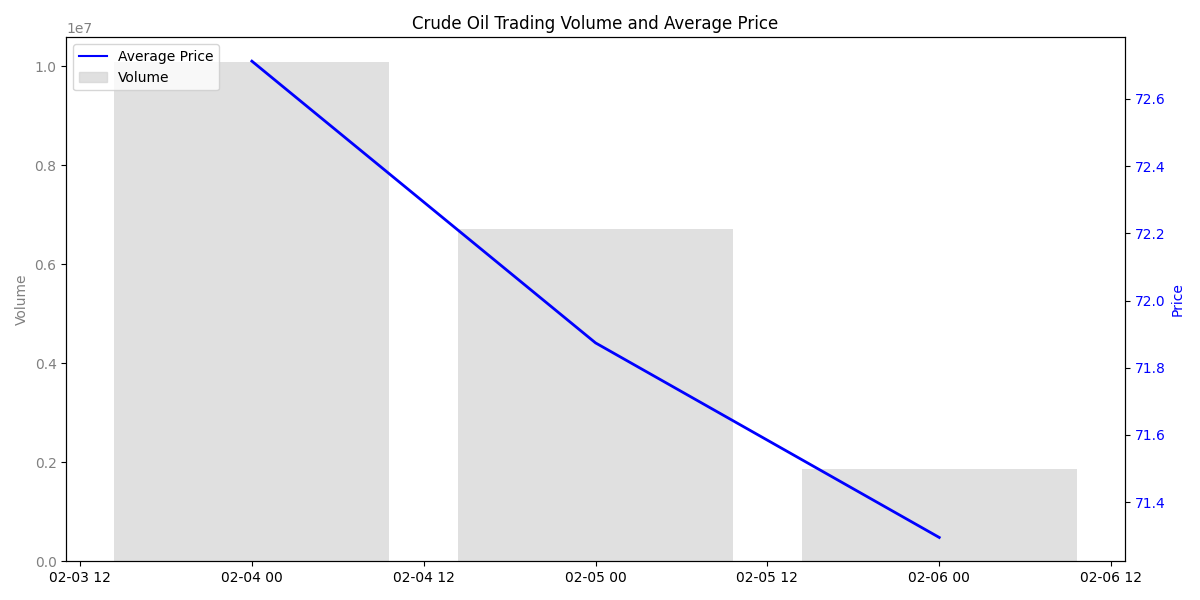
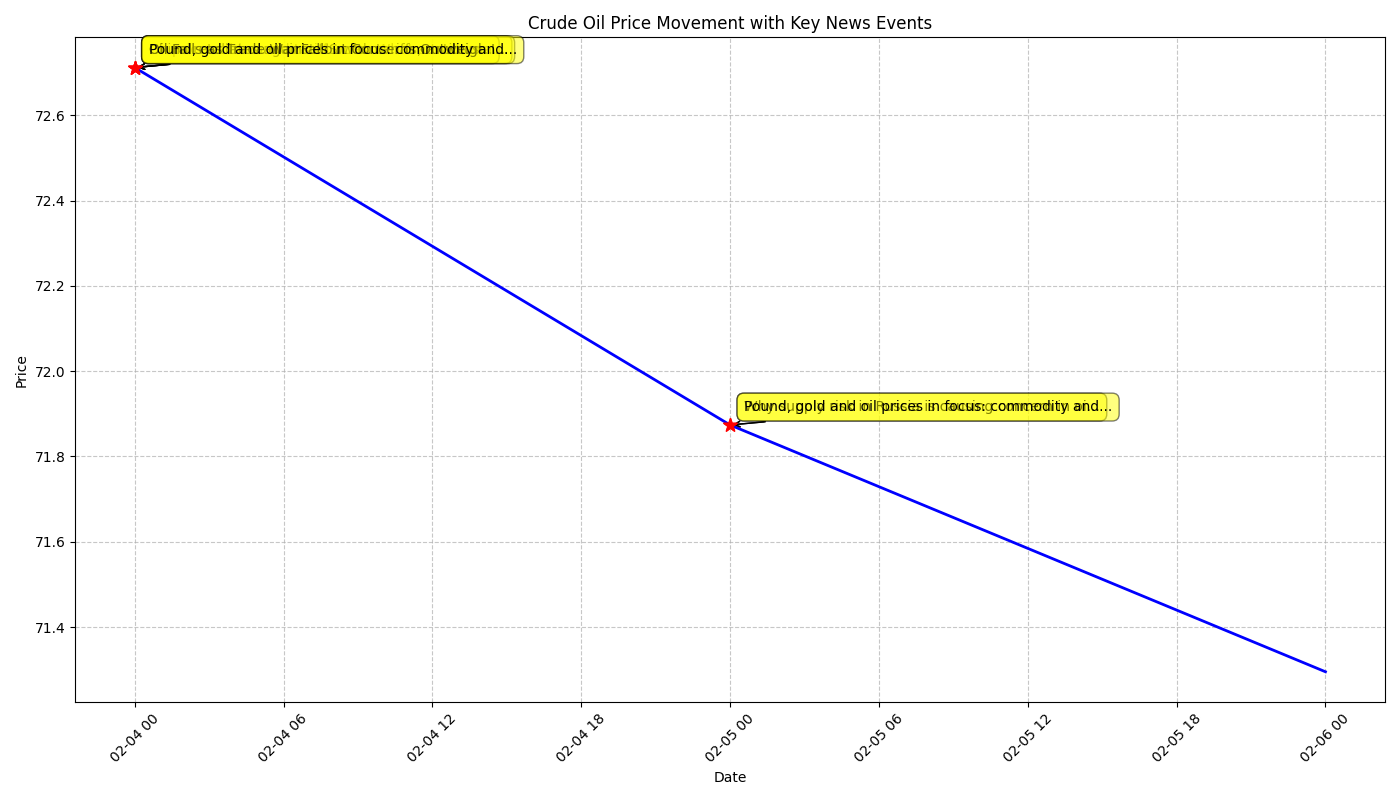
Crude Oil Price Analysis: Recent Trends and Market Dynamics
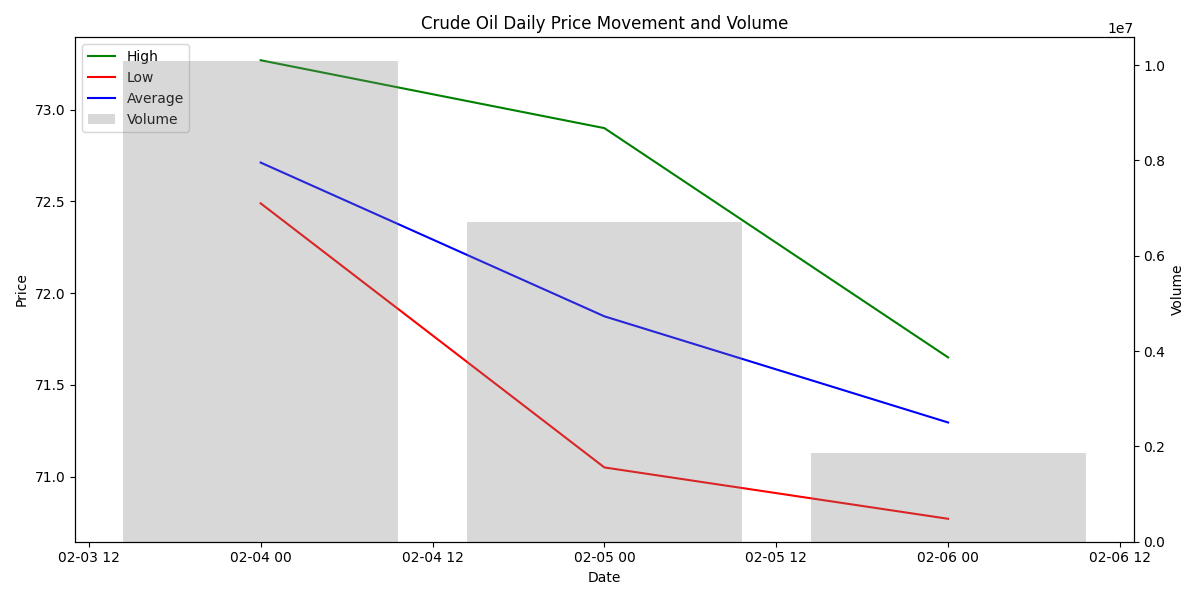
![Daily price movements (high, low, average) and trading volume for crude oil over the past three days Daily price movements (high, low, average) and trading volume for crude oil over the past three days](/assets/analysis/6b1256e4-3dc9-4ce5-89e1-6a8f7b30fc1e//05297a99-84c8-44c8-8372-dd9cc72d739a.png)
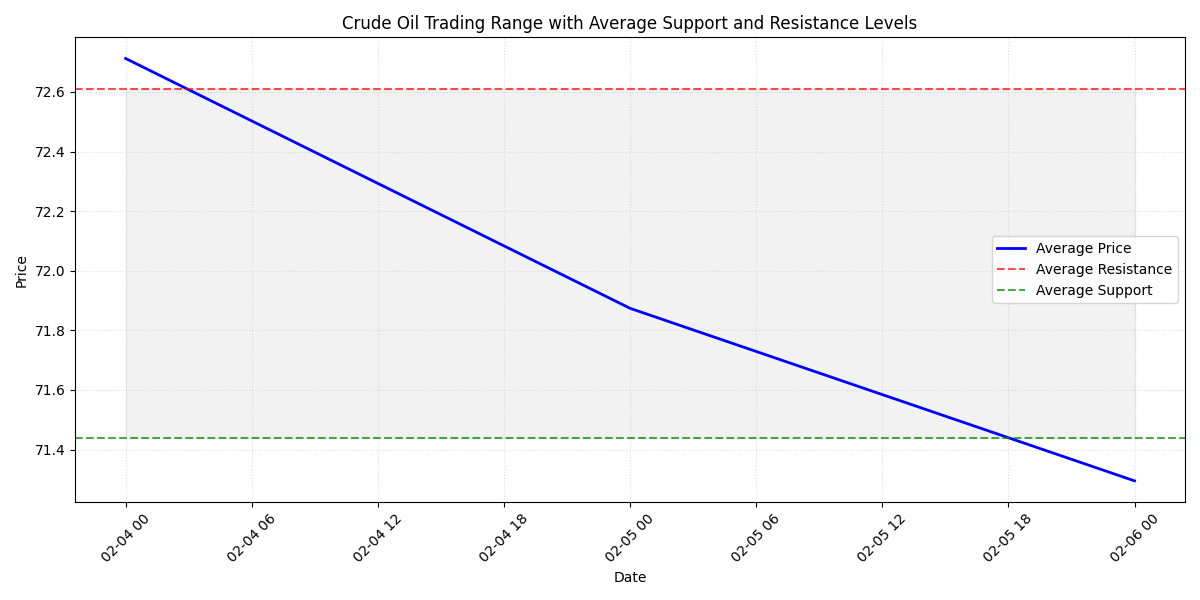
Crude Oil Technical Analysis: Support and Resistance Levels
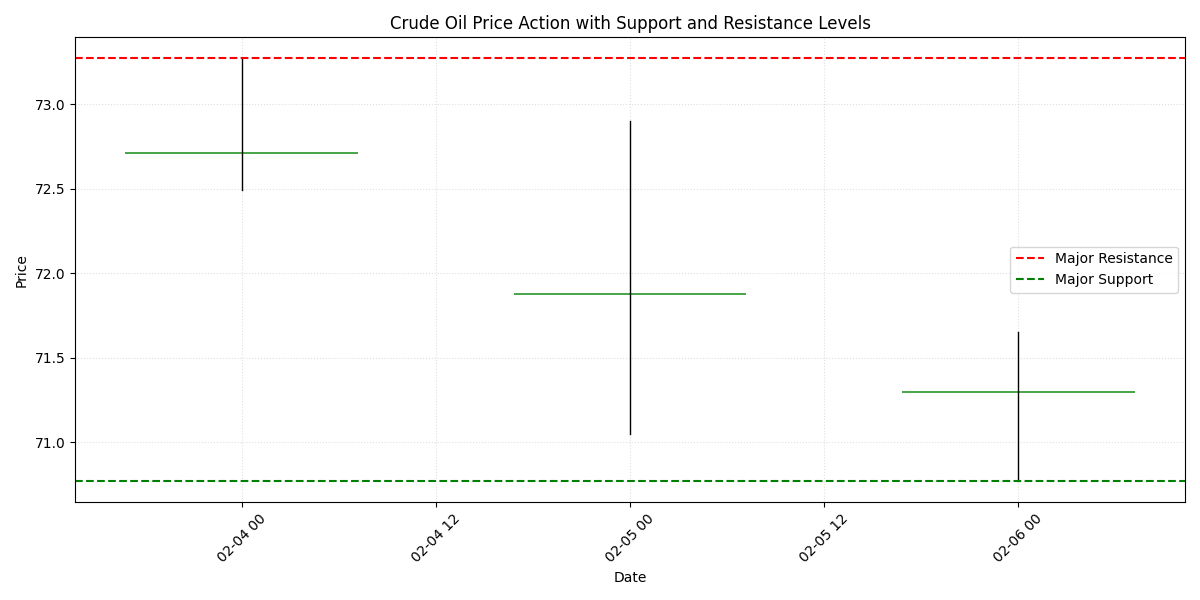
![Candlestick chart showing crude oil price action with major support at $70.77 and resistance at $73.27 Candlestick chart showing crude oil price action with major support at $70.77 and resistance at $73.27](/assets/analysis/6b1256e4-3dc9-4ce5-89e1-6a8f7b30fc1e//4f127842-cbe5-4c9a-9f34-a8d1fd548242.png)
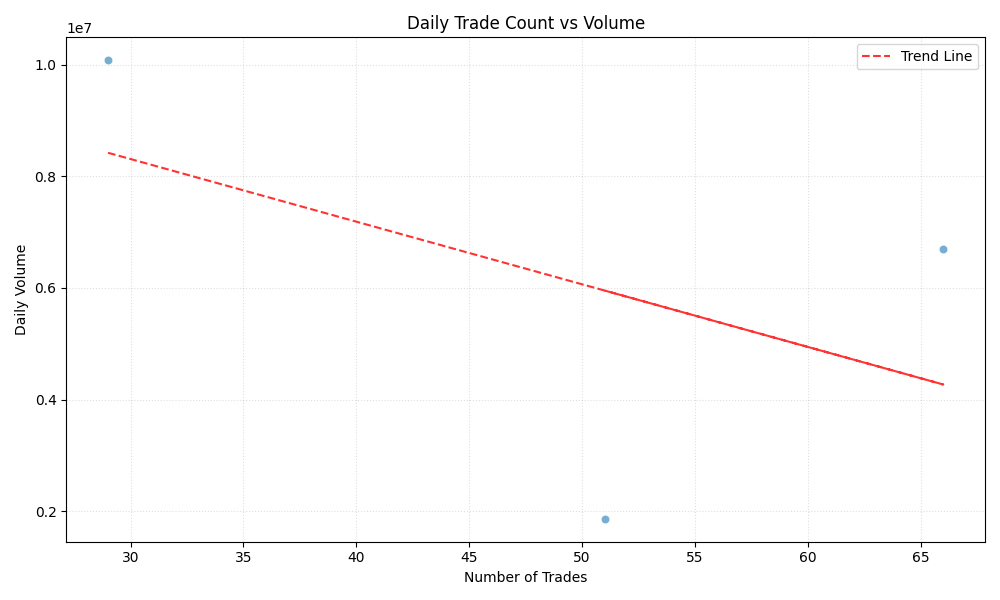
Volume Analysis and Market Participation Patterns
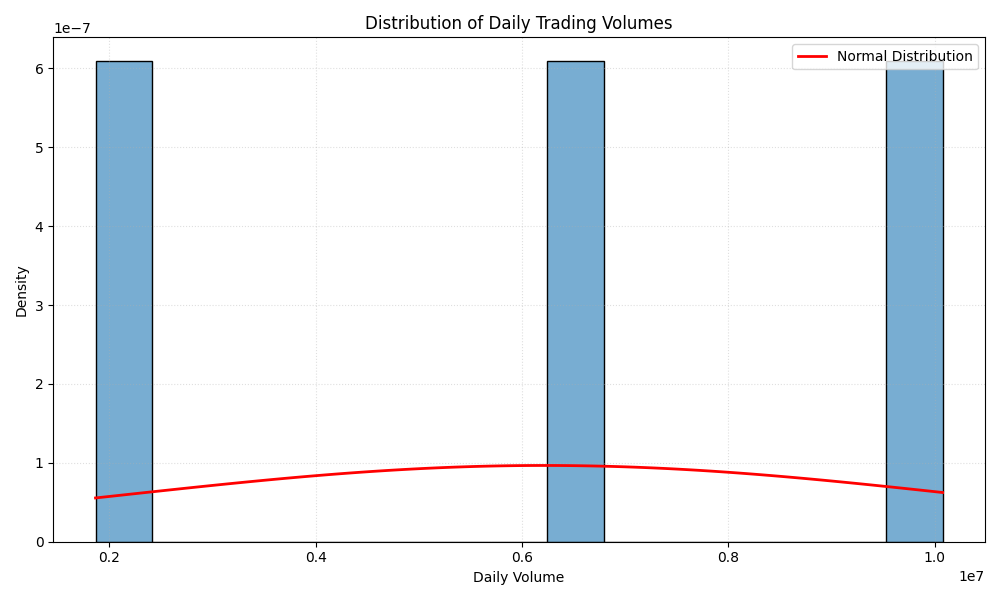
![Distribution of daily trading volumes with normal distribution overlay showing volume patterns Distribution of daily trading volumes with normal distribution overlay showing volume patterns](/assets/analysis/6b1256e4-3dc9-4ce5-89e1-6a8f7b30fc1e//f05d4b8f-6c6f-46b9-a34e-ef0af8a142a8.png)
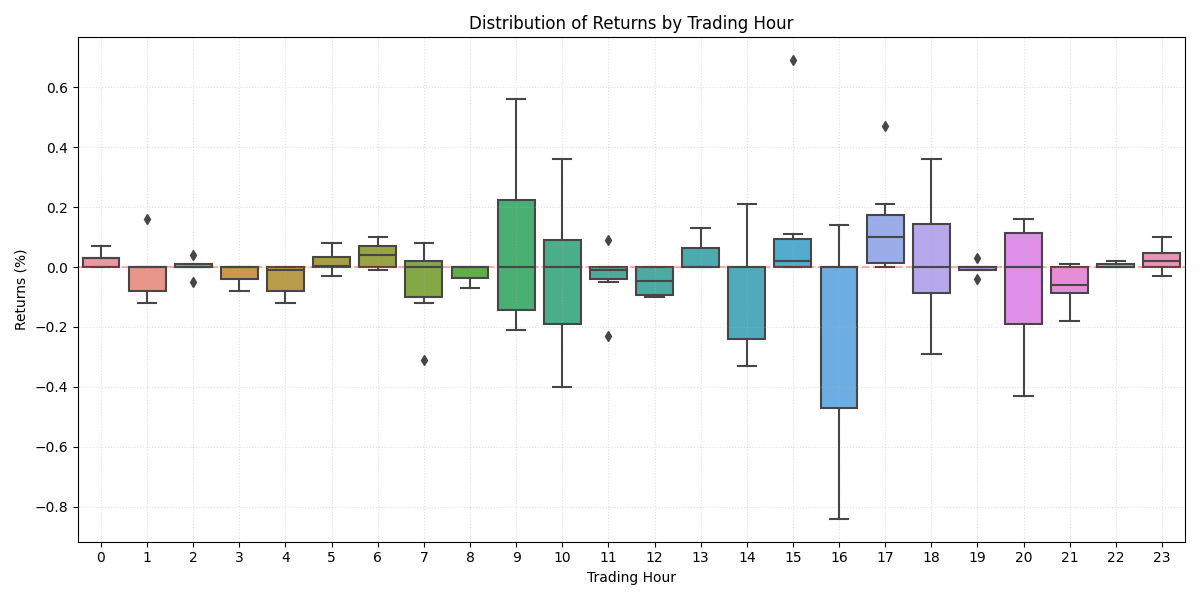
Price Return Analysis and Volatility Patterns
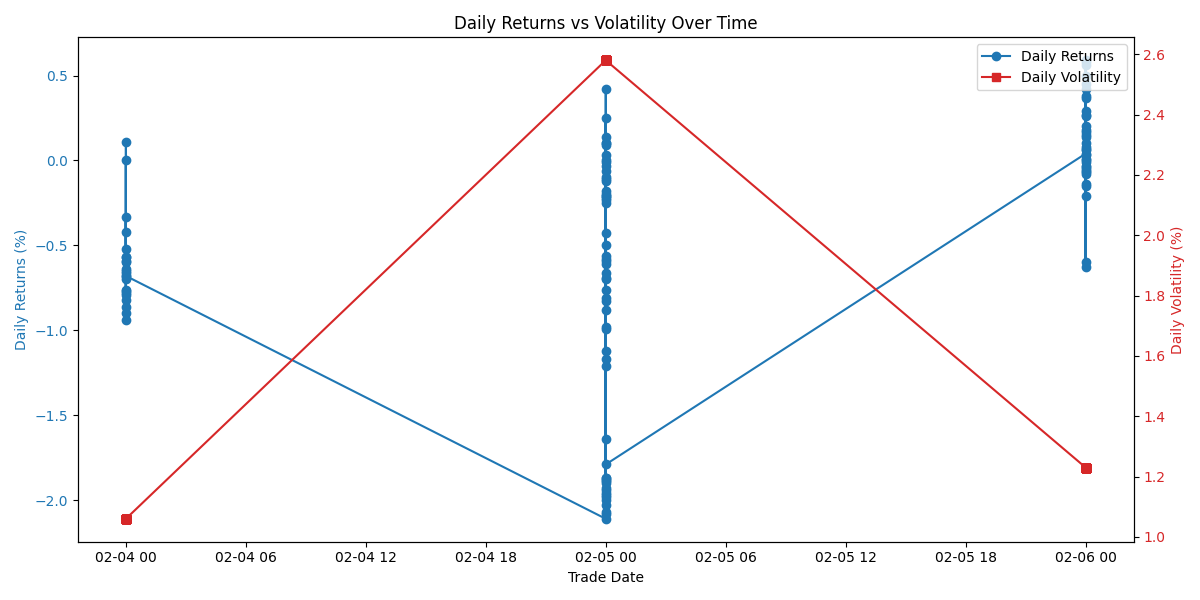
![Dual-axis chart showing the relationship between daily returns and volatility over time Dual-axis chart showing the relationship between daily returns and volatility over time](/assets/analysis/6b1256e4-3dc9-4ce5-89e1-6a8f7b30fc1e//54ff17ee-e61a-4481-ab06-4ce5f3df0b40.png)
Initial Crude Oil Price Prediction Analysis Shows Strong Short-Term Predictability
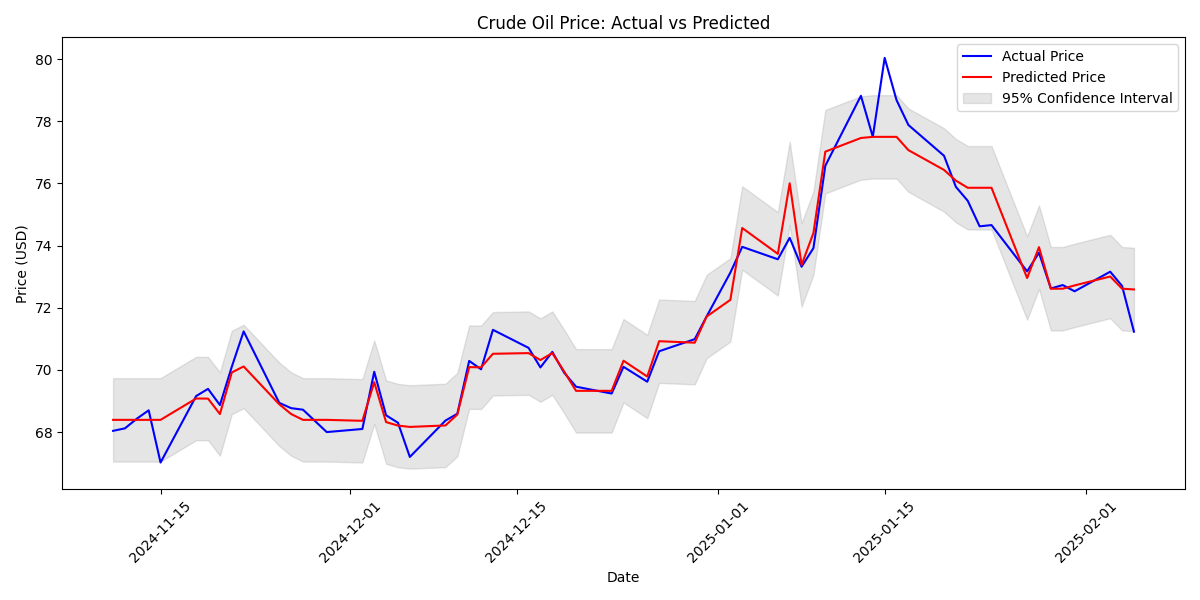
![Line plot comparing actual crude oil prices with predicted prices over time, including 95% confidence intervals to show prediction uncertainty. Line plot comparing actual crude oil prices with predicted prices over time, including 95% confidence intervals to show prediction uncertainty.](/assets/analysis/6b1256e4-3dc9-4ce5-89e1-6a8f7b30fc1e//f7aedec3-4c26-404b-b59e-d685d905fecf.png)
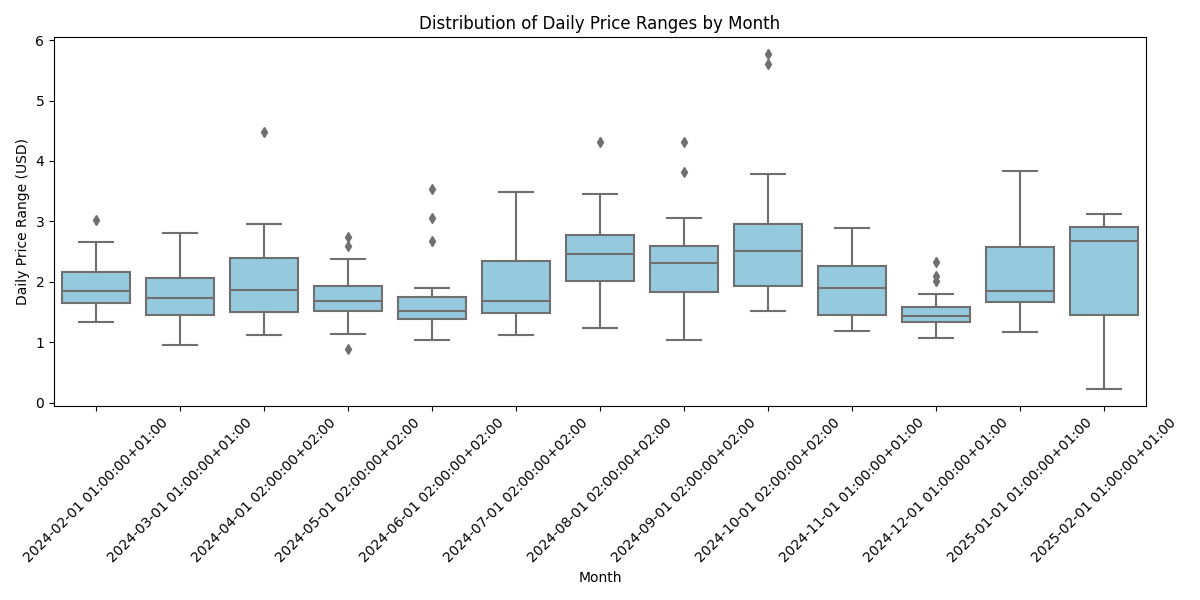
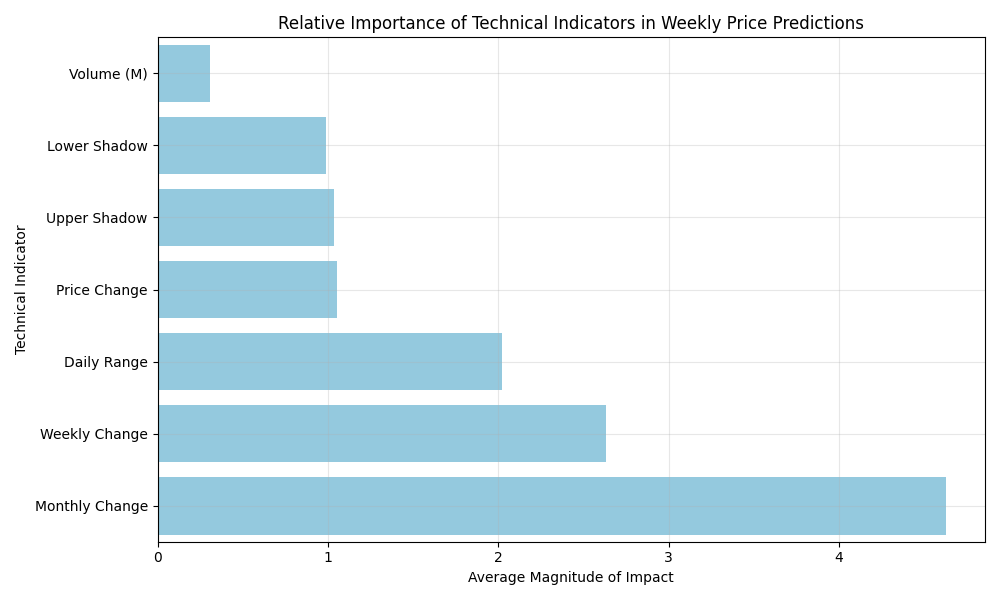
Weekly Crude Oil Price Predictions Show Moderate Volatility with Strong Technical Indicators
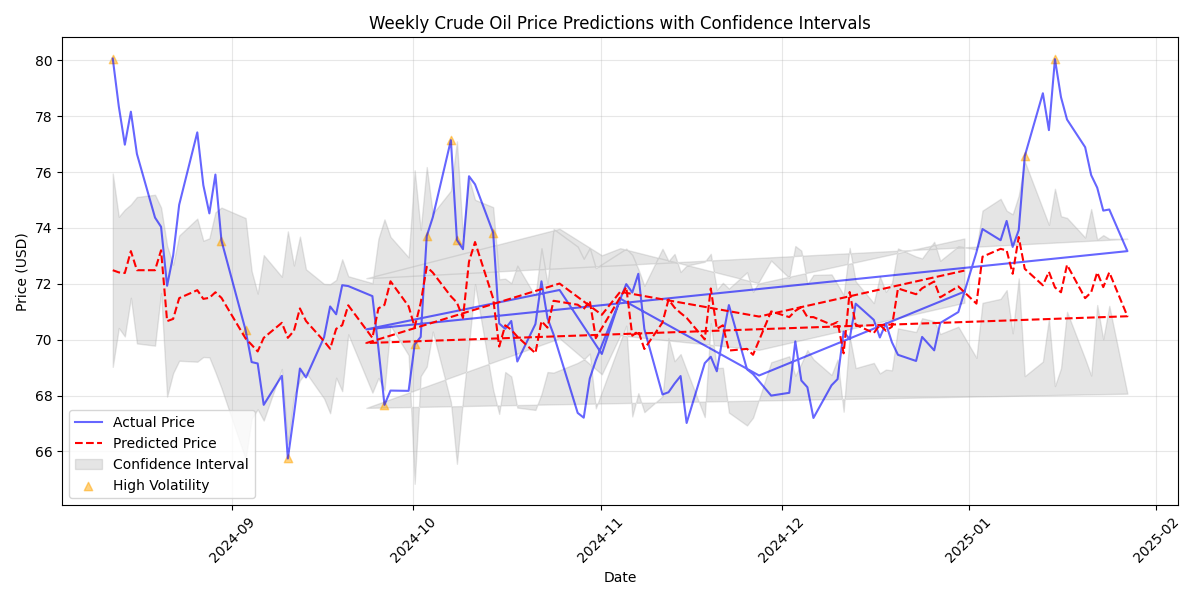
![Line plot showing actual and predicted weekly crude oil prices with confidence intervals, highlighting periods of high volatility based on daily price ranges. Line plot showing actual and predicted weekly crude oil prices with confidence intervals, highlighting periods of high volatility based on daily price ranges.](/assets/analysis/6b1256e4-3dc9-4ce5-89e1-6a8f7b30fc1e//13319e12-79ae-4e69-9c74-e1adb2a5a611.png)
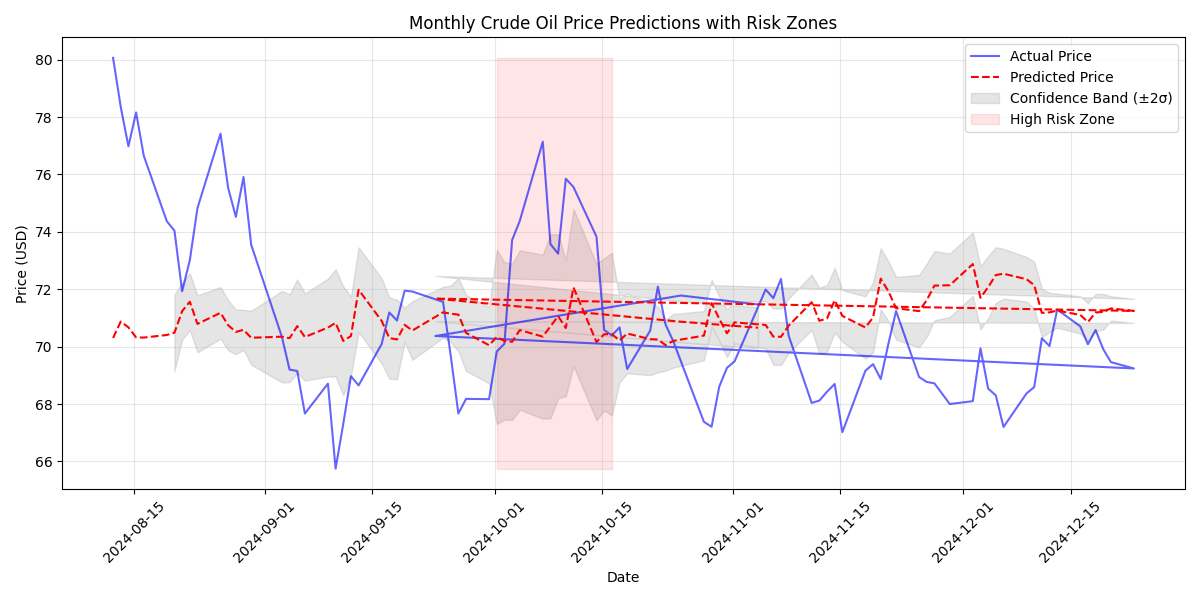
Monthly Crude Oil Price Analysis Reveals Long-term Market Stability with Key Risk Factors
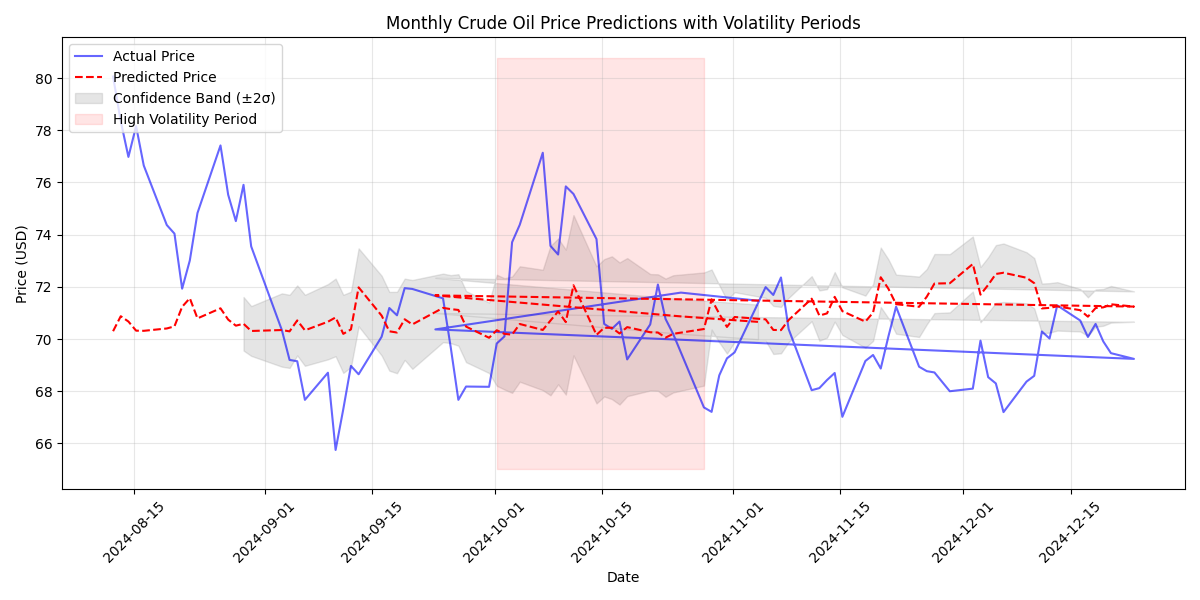
![Time series visualization showing actual and predicted monthly crude oil prices, with confidence bands based on price volatility and highlighted periods of increased market uncertainty. Time series visualization showing actual and predicted monthly crude oil prices, with confidence bands based on price volatility and highlighted periods of increased market uncertainty.](/assets/analysis/6b1256e4-3dc9-4ce5-89e1-6a8f7b30fc1e//56361d66-62a7-474d-a2f7-6d135332beed.png)